Download
1 / 41
420 likes | 551 Views
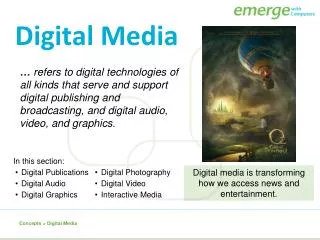
Digital Media. Lecture 3: Image Encoding Bitmapped images Georgia Gwinnett College School of Science and Technology Dr. Jim Rowan. Refer to Supplemental text:. Critical Thinking: What is it that you are not being told ? Introduction to images

E N D
Digital Media Lecture 3: Image Encoding Bitmapped images Georgia Gwinnett College School of Science and Technology Dr. Jim Rowan
Refer to Supplemental text: • Critical Thinking: What is it that you are not being told? • Introduction to images • Ways to store an image as numbers: Bitmapped Graphics • Ways to store an image as numbers: Vector Graphics • Image encoding techniques: Bitmapped Images • BItmapped images: JPEG compression and human vision • BItmapped images: Dithering and Posterization • Integer screen coordinates and bounding boxes • Image encoding: Messing around with the color coding • Art and Mathematics Collide! (of Bezier Curves and Convolution)
The next several lectures will cover… • Bitmapped images • Vector graphics, 2D • Color • Vector graphics, 3D
But first:A little more about “Telling the story” • The media you choose shapes the way the story is told • The way you present data affects how it is interpreted
What would you choose? • You need heart bypass surgery • You have a number of hospitals to choose from • You make your decision based on statistics • Do you choose the hospital with the highest or lowest death rate for that procedure?
The way you displaythe data affects how it is understood • Understanding occurs at the crossroads of computer graphics, cognitive science and psychology • The way data is displayed affects how people interpret it • Colors can enhance or detract from a point • The numeric scales used on a graph • Different types of graphs emphasize different aspects of the numbers
For example:Using a graph to tell the story • Is this the graph of a stable company?
For example:Using a graph to tell the story • Is this the graph of a stable company?
What about anthropogenic global warming? The pro- side:
What about anthropogenic global warming? The anti- side:
What about anthropogenic global warming? The pro- side: 1940 1950 “Look how much of the glacier has melted during this 10 year period”
What about anthropogenic global warming? The anti- side: 1950 2004 “Look how little of the glacier has melted during this 50+ year period”
Now… about those images! • First: Bitmapped images • File size is dictated by: • Width and height • Color depth • Method of encoding • They don’t scale well • Second: Vector graphics • File size dictated by the number of objects • They do scale well • Images as piles of numbers: Intro to Images • Images as piles of numbers: Ways to store images as numbers: Bitmapped images
Bitmapped images • Color depth 1 bit • 10 x 5 = 50 pixels x 1 bit = 50 bits • 50 bits / 8 = 6.25 = 7 bytes
Bitmapped images • Color depth 24 bit (3 byte) RGB • 10 x 5 = 50 pixels • 50 pixels x 3 bytes = 150 bytes • Much bigger
Bitmapped images • Get big fast • We can make them smaller? • Table encoding (next) • Run length encoding (later) • Compression (later)
Bitmapped images: Table encoding • Build a color table: • List the colors in a table • Number them in binary • # 00 White (255.255.255) • # 01 Blue (0,0,255) • # 10 Red (25,0,0) Build a table of pointers: • Color table size: • 3 colors, 3 bytes each color • 3 x 3 = 9 bytes • Pointer table size: • 10 x 5 x 2 bits = 100 bits/8 = 12.5 = 13 bytes • Total encoding size: • 9 bytes + 13 bytes = 21 bytes
Bitmapped vs Vector vector graphic bitmapped graphic Here are two images, blue squares with smaller colored squares inside them Both are displayed as 1024 X 1024 pixels in size Each with 3 byte (24 bit) color encoding Which would have the larger (in terms of file size) internal model? Why?
Vector graphic One way of doing vector graphics… (For discussion’s sake) Defining each square as a pair of x,y points So: each square’s size is defined by 4 numbers Now color them using 3 bytes each 4 squares x 7 4 numbers each x 3 bytes each for color: Total file size = 28 bytes
Bitmapped graphic 1024 x 1024 x 3 = 3,145,728 bytes
Bitmapped vs Vector bitmapped graphic vector graphic Here are two more complex images Both are displayed as 1024 x 1024 pixels in size Each with 3 byte (24 bit) color encoding Which would have the larger (in terms of file size) internal model? Why?
Bitmapped graphic As complexity increases, file size remains the same But it doesn’t scale well Both of these images would have the same file size 1024 x 1024 x 3 = 3,145,728 bytes
Vector graphic As complexity increases, so does the file size But it scales without problems Complex 3000 squares+ Each is defined by 7 numbers (two pairs of points + color) 3000 x 7 = 21,000 bytes Not complex 28 bytes
The point here is: • Scaling is a problem for bitmapped graphics • Scaling is not a problem for vector graphics • Bitmapped graphics don’t change in size as the image gets more complex • Vector graphics get bigger the more complex the image
Visual comparison: Bitmapped scaling Vector graphic scaling
Why doesn’t a bitmapped image scale well? Original image: 10 x 5 Now make it twice as big
Why doesn’t a bitmapped image scale well? Original image: 10 x 5 Now make it twice as big in two dimensions
Why doesn’t a bitmapped image scale well? Original image: 10 x 5 Now make it twice as big What happens if there are two colors next to one another?
Why doesn’t a bitmapped image scale well? Original image: 10 x 5 Now make it twice as big What happens if there are two colors next to one another?
Why doesn’t a bitmapped image scale well? Original image: 10 x 5 To make it 50% larger...
Why doesn’t a bitmapped image scale well? To make it 50% larger… Is it going to be 3 pixels long? Is it going to be 4 pixels long?
Making it smaller…A simple example Making it 50% smaller in two dimensions Involves tossing out 75% of the pixels…
Making it smaller…A more complicated example Now… mixed colors: What color do you use? The point here is that scaling Bitmapped images is problematic
The point here is: • Scaling is a problem for bitmapped graphics
Manipulating images • Both Bitmapped and Vector graphics images use image layers as organizational tools • Bitmapped images can use layers • Like tracing paper • Like stencils • To manipulate color channels
Bitmapped image manipulation • Bitmapped images do not know what objects they contain so there are a variety of selection tools • Regular shapes like square and circles • Irregular shapes • lasso (polygon, magnetic, magic wand…) • “magnetic" snaps to an enclosed object using edge-detection routines
Bitmapped image manipulation • Selection tools allow the application of filters to only the selected parts of the image • The unaffected area is called a mask... can be thought of as a stencil • The opening in the mask allows background to show through
Masks as layers • A 1-bit mask • Either a 0 or a 1 • can be either transparent or opaque • An 8-bit mask • allows 2 ** 8 = 256 levels of transparency... • AKA alpha channel
Masks • Can have a gradient to produce a softer transition... a feathered edge • Can use anti-aliasing along the edge which more effectively hides the hard edge visually • Layers can have masks associated with them • Allows interesting compositing of image parts