Download
1 / 38
540 likes | 1.2k Views
CHAPTER 3 VOLUMETRIC PROPERTIES OF PURE FLUIDS. Objectives. Introduce the concept of a pure substance. Discuss the physics of phase-change processes. Illustrate the P - v , T - v , and P - T property diagrams and P - v - T surfaces of pure substances.

E N D
CHAPTER 3 VOLUMETRIC PROPERTIES OF PURE FLUIDS
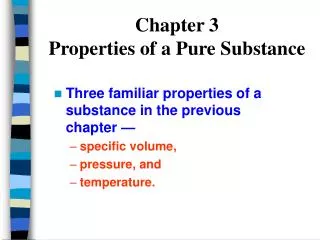
Objectives • Introduce the concept of a pure substance. • Discuss the physics of phase-change processes. • Illustrate the P-v, T-v, and P-T property diagrams and P-v-T surfaces of pure substances. • Demonstrate the procedures for determining thermodynamic properties of pure substances from tables of property data. • Describe the hypothetical substance “ideal gas” and the ideal-gas equation of state. • Apply the ideal-gas equation of state in the solution of typical problems. • Introduce the compressibility factor, which accounts for the deviation of real gases from ideal-gas behavior. • Present some of the best-known equations of state.
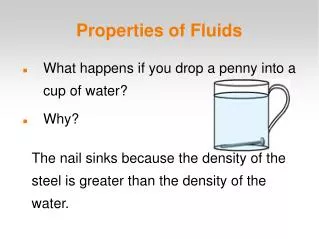
Pure Fluids/ Substance • A substance that has a fixed chemical composition throughout is called a Pure Substance. • Pure Substance: -N2, O2, gaseousAir -A mixture of liquid and gaseous water is a pure substance, but a mixture of liquid and gaseous air is not.
PHASES OF A PURE SUBSTANCE The molecules in a SOLID are kept at their positions by the large springlike inter-molecular forces. In a solid, the attractive and repulsive forces between the molecules tend to maintain them at relatively constant distances from each other. The arrangement of atoms in different phases: (a) molecules are at relatively fixed positions in a solid, (b) groups of molecules move about each other in the LIQUID phase, and (c) molecules move about at random in the GAS phase.
Phase-Change Processes of Pure Substance • Compressed liquid or a subcooledliquid: A liquid that is not about to vaporize. • Saturated liquid:A liquid that is about to vaporize. • Saturated vapor:A vapor that is about to condense. • Saturated liquid-vapor mixture:the liquid and vapor phases coexist in equilibrium. • Superheated vapor:A vapor that is notabout to condense
T-v diagram for the heating process of water at constant pressure. 2-1
Phase-Change Processes of Pure Substance • Saturated temperature, Tsat:At a given pressure, the temperature at which a pure substance changes phase. • Saturated pressure, Psat:At a given temperature, the pressure at which a pure substance changes phase. • Latent heat:the amount of energy absorbed or released during a phase-change process. • Latent heat of fusion:the amount of energy absorbed during melting. • Latent heat of vaporization:the amount of energy absorbed during vaporization.
Phase changes process • Macromedia 3.3
PVT BEHAVIOR OF PURE SUBSTANCES/ FLUIDS Critical point – highest combination of pressure and temperature where the fluid exist in liq-vap equilibrium The 2-C line, also known as vaporization curve is where liquid-vapor is in equilibrium Triple point, three phases exist in equilibrium (F=0) The 2-3 line, also known as fusion curve is where solid-liquid is in equilibrium The 1-2 line, also known as sublimation curve is where solid-vapor is in equilibrium
PV diagram Boundaries in PT diagram becomes region when illustrate with PV diagram Critical point becomes peak of the curve Triple point becomes horizontal line Macromedia 3.4
Compressed liquid region Saturated liquid line at boiling temperature Superheated vapor region Saturated vapor line at condensation temperature T >Tc, the line do not cross the boundary Isotherms in sub-cooled/ compressed lliquid region are steep, because liquid volumes change little with large changes in pressure
SINGLE PHASE REGION At single phase regions in PV diagram, there is a relation connecting P,V and T. This relation known as PVT equation of state; f(P,V,T)=0 If V is considered as a function of T and P, then V=V(T,P)
The combination will yield; Because the isotherms on the left side of PV diagram are very steep, both β and κ are small. Because of that, the liquid is known as incompressible fluid, where both constants are equal to zero However, this is just idealization, and in incompressible fluid, no equation of state exist, since V is independent of T and P If, we still want to calculate, for liquids, β is positive, and κ is positive as well. Integration of 3.4 yield Check out Ex 3.1
Virial Equation of State The coefficients a(T), b(T), c(T), and so on, that are functions of temperature alone are called virial coefficients. Ideal-Gas Temperature; Universal Gas Constant
Limiting value (asterisk) PV* = a = f(T) Figure 3.4: Plot of PV vs. P for 4 gaseous at triple-point temperature of water. The limiting value of PV as P0 is the same for all of the gaseous. This properties of gaseous is the basis for establishing an absolute temperature scale.The simplest procedure to define Kelvin scale: • (PV)* = a ≡ RT • (PV)*t = R x 273.16K 3. (3.8) (3.9)
In the limit, P0, molecules separated by finite distance • Volumes becomes negligible compare with the total volume • of the gas, and intermolecular forces approach zero • These condition define an IDEAL GAS state & Eq. 3.9 establishes • the ideal-gas temperature scale • The proportionality constant R = universal gas constant Through the use of conversion factors, R may be expresses in various units. Commonly used values are given as above table.
2 Forms of the Virial Equation (3.10) • Auxiliary thermodynamic property = • = Compressibility factor • Z = 1 + B’P+C’P2 +D’P3 +… • Z= 1 + B/V +C/V2 + D/V3 +… • Virial expansion = Eq 3.11 & Eq 3.12 • B’, C’, D’ …, B, C, D = virial coefficient • B’ = 2nd virial coefficient • C’ = 3rd virial coefficient…etc (3.11) (3.12)
THE IDEAL GAS • Because the Eq 3.12 arise on account of molecular interactions, the virial coefficients B,C…etc = 0 were no such interaction to exist • Phase Rule = Internal energy of a real gas is a function of pressure as well as of temperature. Macromedia 3.6
Ideal gas equation of state R: gas constant M: molar mass (kg/kmol) Ru: universal gas constant Different substances have different gas constants. THE IDEAL GAS • Equation of state: Any equation that relates the pressure, temperature, and specific volume of a substance. • The simplest and best-known equation of state for substances in the gas phase is the ideal-gas equation of state. This equation predicts the P-v-T behavior of a gas quite accurately within some properly selected region. U = U(T) (Ideal gas) (3.15)
Implied Property Relations for an Ideal Gas (f(T) only) • Heat Capacity for constant volume, Cv • Eq 2.11 applied to an Ideal Gas (3.1) (3.17)
Implied Property Relations for an Ideal Gas (f(T) only) • Heat Capacity for constant pressure, Cp • Useful relation between Cv & Cp (3.18) (3.19) NOTE: This equation does not imply that Cp and Cv are themselves constant for an ideal gas, but only that they vary with temperature in such a way that their differences is equal to R
The graph show that the ∆U= For any ∆ of state of an ideal gas, Eq 3.16 and Eq.3.18 lead to: • T1 & T2 • a---b = Constant volume process • a---c & a---d ≠ constant volume
Equation for Process Calculation for Ideal Gas Working equation of dQ and dW depend on which pair of these variables is selected as independent With P=RT/V, With V=RT/P and Cv given by Eq 3.19, dQ & dW written as Eq.3.24 & Eq.3.25 With T=PV/R, the work is simply dW=-PdV, and with Cv given by Eq.3.19,
Isothermal Process • Q=-W Isobaric Process Isochoric Process
(3.31) IMPORTANT: Eq 3.30 are restricted in application to ideal gases with Constant Heat capacities undergoing mechanically reversible adiabatic expansion or compression For ideal gas, the WORK of any adiabatic closed-system process is given by: (3.32) Because RT1 = P1V1 and RT2 = P2V2, (3.33)
Elimination of V2 from Eq 3.33 by Eq 3.30c, valid for mechanically reversible process, lead to: (3.34) Polytropic Process
Isobaric process Isothermal process Adiabatic process Isochoric process Polytropic Process
APPLICATION OF VIRIAL EQ. All isotherms originate at Z=1 for P=0
(3.38) Applied to vapors at sub critical temperature up to their saturation pressure When the virial equation is truncated to 3 terms, the appropriate form is: (3.40)
CUBIC EQ. OF STATE 1. The Van der Waals Equation of state (3.41) 2. A Generic Cubic Equation of State (3.42) 3. Determination of Eq-of State Parameters
4. Theorem of Corresponding State: Acentric Factor (3.48) NOTE: All fluid having the same value of , when compared at the same Tr And Pr have about the same value of Z, and all deviate from ideal gas behavior To about he same degree 5. Vapor& Vapor-like Root of the Generic Cubic Eq of state 6. Liquid & Liquid-like Root of the Generic Cubic Eq of state
GENERALIZE CORRELATION FOR GASES • Pitzer Correlation for the Compressibility Factor • Pitzer Correlation for the 2nd Virial Coefficient • Correlations for the 3rd Virial Coefficient • Condition of Approximate Vlidity of the Ideal-Gas Equation
Summary • Pure substance • Phases of a pure substance • Phase-change processes of pure substances • Compressed liquid, Saturated liquid, Saturated vapor, Superheated vapor • Saturation temperature and Saturation pressure • Property diagrams for phase change processes • The T-v diagram, The P-v diagram, The P-T diagram, The P-v-T surface • The ideal gas equation of state • Is water vapor an ideal gas? • Compressibility factor • Other equations of state
Thank you Prepared by, NMJ