Download
1 / 1
10 likes | 126 Views
Regional Variation in Tobacco Use: A Community Health Survey of Urban, Suburban, and Rural Households

E N D
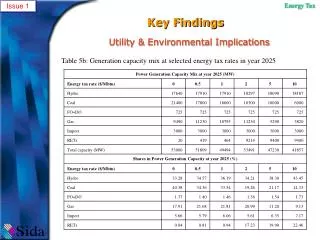
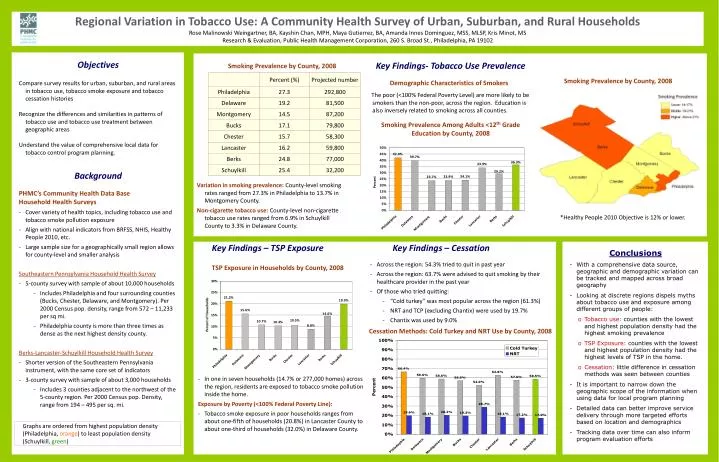
Regional Variation in Tobacco Use: A Community Health Survey of Urban, Suburban, and Rural Households Rose Malinowski Weingartner, BA, Kayshin Chan, MPH, Maya Gutierrez, BA, Amanda Innes Dominguez, MSS, MLSP, Kris Minot, MS Research & Evaluation, Public Health Management Corporation, 260 S. Broad St., Philadelphia, PA 19102 • Objectives • Compare survey results for urban, suburban, and rural areas in tobacco use, tobacco smoke exposure and tobacco cessation histories • Recognize the differences and similarities in patterns of tobacco use and tobacco use treatment between geographic areas • Understand the value of comprehensive local data for tobacco control program planning. • Background • PHMC’s Community Health Data Base • Household Health Surveys • Cover variety of health topics, including tobacco use and tobacco smoke pollution exposure • Align with national indicators from BRFSS, NHIS, Healthy People 2010, etc. • Large sample size for a geographically small region allows for county-level and smaller analysis • Southeastern Pennsylvania Household Health Survey • 5-county survey with sample of about 10,000 households • Includes Philadelphia and four surrounding counties (Bucks, Chester, Delaware, and Montgomery). Per 2000 Census pop. density, range from 572 – 11,233 per sq mi. • Philadelphia county is more than three times as dense as the next highest density county. • Berks-Lancaster-Schuylkill Household Health Survey • Shorter version of the Southeastern Pennsylvania instrument, with the same core set of indicators • 3-county survey with sample of about 3,000 households • Includes 3 counties adjacent to the northwest of the 5-county region. Per 2000 Census pop. Density, range from 194 – 495 per sq. mi. Key Findings- Tobacco Use Prevalence Smoking Prevalence by County, 2008 Smoking Prevalence by County, 2008 Demographic Characteristics of Smokers The poor (<100% Federal Poverty Level) are more likely to be smokers than the non-poor, across the region. Education is also inversely related to smoking across all counties. Smoking Prevalence Among Adults <12th Grade Education by County, 2008 Variation in smoking prevalence:County-level smoking rates ranged from 27.3% in Philadelphia to 13.7% in Montgomery County. Non-cigarette tobacco use: County-level non-cigarette tobacco use rates ranged from 6.9% in Schuylkill County to 3.3% in Delaware County. *Healthy People 2010 Objective is 12% or lower. Key Findings – TSP Exposure Key Findings – Cessation • Conclusions • With a comprehensive data source, geographic and demographic variation can be tracked and mapped across broad geography • Looking at discrete regions dispels myths about tobacco use and exposure among different groups of people: • Tobacco use: counties with the lowest and highest population density had the highest smoking prevalence • TSP Exposure: counties with the lowest and highest population density had the highest levels of TSP in the home. • Cessation: little difference in cessation methods was seen between counties • It is important to narrow down the geographic scope of the information when using data for local program planning • Detailed data can better improve service delivery through more targeted efforts based on location and demographics • Tracking data over time can also inform program evaluation efforts • Across the region: 54.3% tried to quit in past year • Across the region: 63.7% were advised to quit smoking by their healthcare provider in the past year • Of those who tried quitting: • “Cold turkey” was most popular across the region (61.3%) • NRT and TCP (excluding Chantix) were used by 19.7% • Chantix was used by 9.0% TSP Exposure in Households by County, 2008 Cessation Methods: Cold Turkey and NRT Use by County, 2008 • In one in seven households (14.7% or 277,000 homes) across the region, residents are exposed to tobacco smoke pollution inside the home. • Exposure by Poverty (<100% Federal Poverty Line): • Tobacco smoke exposure in poor households ranges from about one-fifth of households (20.8%) in Lancaster County to about one-third of households (32.0%) in Delaware County. • Graphs are ordered from highest population density (Philadelphia, orange) to least population density (Schuylkill, green)