Download

1 / 13
130 likes | 232 Views
Transatlantic Dialogue Montpellier, France November 22, 2005. The European Mobile Industry – A Case for Consolidation?. Wolfgang Kopf, LL.M. Executive Vice President T-Mobile International AG & Co. KG. Agenda. About T-Mobile European Mobile Markets US Mobile Markets

E N D
Transatlantic DialogueMontpellier, FranceNovember 22, 2005 The European Mobile Industry – A Case for Consolidation? Wolfgang Kopf, LL.M. Executive Vice PresidentT-Mobile International AG & Co. KG
Agenda • About T-Mobile • European Mobile Markets • US Mobile Markets • Key difference between European and US Mobile Markets • Main hurdles for Consolidation in Europe
About T-Mobile • T-Mobile International AG & Co. KG was established in December 1999 and is one of the largest mobile communications operators worldwide (3rd place in terms of Revenues, 4th place in terms of subscribers) • T-Mobile International was the first seamless transatlantic mobile network operator and is still the only one • DT Group holds direct or indirect investments in mobile communications companies in 15 countries with more than 83 million subscribers • Net revenue of T-Mobile International was 25,0 billion Euros in 2004 (eoy)
T-Mobile US (100%) • No. 4 Player * • T-Mobile CZ (56.0%) • No. 1 player • T-Mobile Hungary (59.2 %)** • No. 1 Player • T-Mobile AT (100 %) • No. 2 player Our Footprint • PTC (Poland, 49 .0%) • No. 1 Player • T-Mobile D (100 %) • No. 1 Player • T-Mobile NL (100%) • No. 3 player • Mobimak (Macedonia, 30.2%)** • No. 1 Player • T-Mobile UK (100%) • No. 1 Player (w/ Virgin Mobile) • Monet (Montenegro, 45.5%)** • No. 2 Player • T-Mobile Croatia (51.0 %)** • No. 1 Player • Eronet (Bosnia, 25.0%)** • No. 3 Player • T-Mobile Slovakia (51.0 %)** • No. 2 Player Notes: Ranking based on subscribers number (status as of Q2/2005). Percentage of stakes in brackets. * No. 4 player after closing of Sprint / Nextel merger ** Pro rata as (local) fixed line is holding the shares in the local mobile operation • T-Mobile branded • Not T-Mobile branded
T-Mobile US • Established under the name of VoiceStream in 1994; in July 2002, the company became T-Mobile US • Subsidiary of T-Mobile International (100%) • More than 20.0 million subscribers • Market share 10% • US-Penetration rate 66 % • T-Mobile US has the largest GSM network in the USA • T-Mobile US is the largest Wi-Fi provider in the USA • Four awards by J.D. Power and Associates in 2004, among them “Highest Overall Satisfaction Among Wireless Telephone Users”, and already two further awards in 2005, among them “Highest Overall Business Customer Satisfaction”
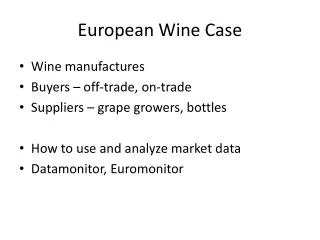
EU25 Communications Market Volumes EU25 communications markets growing faster than GDP. Mobile and fixed data services main growth drivers. Fixed voice service revenues steadily declining. EU25 Communications Market Volumes(€ bn) 1.7% 1.1% 0.9% 2.4% EU25 GDP growth 5.3% 6.7% 3.9% 4.9% Yearly growth CAGR 5.3% Cable TV Services 12.3% 18.3% 15.1% Fixed Data Services 32.5% --0.7% 38.6% Fixed Voice Services 44.1% 7.6% 41.4% Mobile Services ... % = share at total market volume Source: EU Commission (10th Communications report)
EU15/EU25 Mobile Subscriber Development European mobile markets approaching saturation. Addressable market penetration already higher than 100%. Prepaid main growth driver. Mobile Subscribers (SIM cards) and Penetration in EU 15 & EU 25(in m) Subscriber EU 15 Subscriber EU 25 Prepaid penetration 62% 63% CAGR 00-04:11% (EU15) 2000 2001 2002 2003 2004 2Q 2005 94% 96% 63% 75% 79% 86% EU15 Populationpenetration 91% 94% EU25 Sources: Mobile Communications/Baskerville, Merrill Lynch (April/September 2005), Eurostat, own calculations Note: Total EU25 population of 458m by end of 2004, EU15 with 384m population. End of year penetration rate. CAGR = Compound Annual Growth rate; EU = Europe
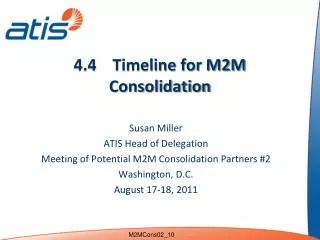
European Mobile Competition – Key EU25 countries Fierce Competition but no Consolidation yet. Mobile Network operators & service providers / MVNOs / mobile brands Key EU25 countries – 2Q 2005 Service providers / MVNO / mobile brands Mobile network operators with GSM and/or UMTS licenses Mobile penetration 2Q 2005 (SIM cards as of population) 99% 108% 67% 109% 103% 109% 114% 102% 75% 100% 90% 95% 111% 88% 103% 106% Sources: EU Commission (10th Communications report), Merrill Lynch (September 2005), own analysisMVNO = Mobile Virtual Network Operator ; SIM = Subscriber Identity Module
US Mobile Subscriber Market Development US market with considerable subscriber growth. 66% population penetration reached by end of June 2005. + 6.7% Total US Mobile Subscriber(in m) CAGR 95-04:20.6 % Penetration 66 % Key subscriber growth drivers Introduction of digital network technologies (TDMA, GSM & CDMA in 1994/95) Better handset selection (especially related with introduction of GSM & CDMA) Attractive price plans (e.g. minute buckets, prepaid tariffs, family tariff plans) Introduction of national roaming Improved network quality & coverage, especially in-house and in rural areas Mobile data services (e.g. SMS, corporate applications used via data cards), mostly since 2002 Source: CTIA, own estimates
US Mobile Competition Market already consolidated. US Subscriber Market Shares 2Q 2005 Key competition characteristics After consolidation, four (from initially six) national operators controlling about 79% of total US subscriber base Remaining 21% controlled by affiliates of national operators (e.g. Sprint / Nextel affiliates), regional/local players (e.g. Alltel, US Cellular, Cincinnati Bell) and MVNOs/resellers (e.g. Virgin Mobile, Boost Mobile, TracFone) 100% = 194,4m subs (+14.7% yoy) Total US Subscribers 2Q 2005(in m) Source: CTIA, reported company data, own calculations.Note: Sprint figures without wholesale & affiliates (included in others). Sprint / Nextel merger closed in August 2005 yoy = year on year ; BTA = Basic Trading Areas (see page 20 for overview)
Key differences between Europe & USA Six key differences Market structure / Regulatory Characteristics Network technologies installed / Coverage Competition level Subscriber growth / penetration development Pricing schemes Usage behavior (voice, data)
Main hurdles for Consolidation in Europe • De facto spectrum cap • Licensing areas determine the relevant geographic market • New EU Merger Rules and SIEC Test • No clear division of jurisdiction among competent authorities • Culture?
Thank you for your attention. Wolfgang Kopf, LL.M. Executive Vice President Public & Regulatory AffairsT-Mobile International AG & Co. KG Landgrabenweg 151, D-53227 Bonn, Germany Mail: wolfgang.kopf@t-mobile.net