Download
1 / 43
430 likes | 561 Views
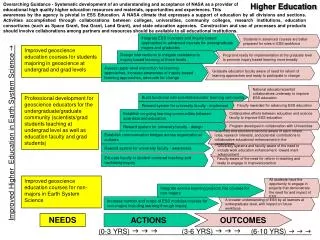
Center for Science in the Earth System. Annual Meeting June 8, 2005 Briefing: Hydrology and water resources. 1. CSES-funded projects. Hydrologic impacts of 20 th Century climate change in the western U.S. Trends in April 1 SWE 1950-1997. Source: Mote et al. (2005). 1916-1997

E N D
Center for Science in the Earth System Annual Meeting June 8, 2005 Briefing: Hydrology and water resources
Hydrologic impacts of 20th Century climate change in the western U.S.
Trends in April 1 SWE 1950-1997 Source: Mote et al. (2005)
1916-1997 Effects of Temp DJF AVG T (C) Relative Trend in April 1 SWE (% per year) Source: Hamlet et al, 2005
Decadal Climate Variability Doesn’t Explain the Loss of SWE Due to Warming 1925-46 with 1977-95 1916-97 1947-97 Relative SWE Trends Due to Temperature Effects Alone (% per year) Source: Hamlet et al, 2005
Effects of Climate Change on Freshwater Inputs to Puget Sound
Digital Elevation Model of the Puget Sound Drainage Basin at 1/8th Degree Elevation (m)
Current Climate 2040s (+2.5 C)
Changes in (Runoff + Baseflow) to Puget Sound for Comp2040 Scenario (+ 2.5 C)
Hydrologic Data for Planning Studies Selected Studies/Models Currently Supported: ColSim (monthly) IDWR/SnakeSim (weekly) NWPCC GENESYS (split month) USBR Flathead Study (daily) Salmon River salmon impacts (daily)
Reconstructed Naturalized Weekly and Daily Flows at Palisades Dam for 1958-1992 Weekly Flow 1958-1992 Streamflow (cfs) Daily Flow 1958-1962
New data processing methods were developed to produce daily time step climate change data for USBR Flathead River study
Average July PotET over the Southern Plain Region Current Climate vs. MPI2040 scenario Current Climate MPI2040 PotET (mm/day)
Trends in July Avg PotET over the Southern Plain Region from 1915-2002
Regional-Scale Decision Support for Small Watershed Planning
Example: Hydrologic Summary for WRIA 38 Naches River Basin 1916-2003 Elevation (m)
Change in Basin Water Balance for the Naches River Current Climate Changes + 2.5 °C 2040s
Snake River Basin • Purpose: Evaluate the potential impacts of climate change on the system through 2060 and develop alternative operating strategies • Research Goal: Comprehensive simulation model • SnakeSim incorporate current system operations, water rights, and surface-groundwater interactions • Accomplishments • Completed simulation model incorporates flexible water rights, groundwater operations, environmental targets, and hydropower production • SWE-based statistical forecasting approach developed for the determination of flood storage, water rights allocation, and fish flow requirements • The statistical forecast replaces perfect forecasting approach currently used in Bureau and State (IDWR) planning models
Snake River Basin • Purpose: Evaluate the potential impacts of climate change on the system through 2060 and develop alternative operating strategies • Research Goal: Comprehensive optimization model • SIRAS incorporates current system operations to optimize crop selection and irrigation, groundwater pumping practices, hydropower production, and instream flow target satisfaction • Accomplishments • Completed optimization model uses an economic objective function to develop sustainable system-wide long-term operating practices • Currently under development: statistical correlation of optimal operating practices to SWE, to develop new operating rules for use in SnakeSim
Covariation of CA and PNW Hydropower from 1917-2002 Source: Voisin et al, 2005
Predictability of PNW Surplus Hydropower as a Function of ENSO and PDO Source: Voisin et al, 2005
West-wide experimental hydrologic forecast system
Modeling Framework Snowpack Initial Condition Soil Moisture Initial Condition
Forecast points and sample streamflow forecasts monthly hydrographs targeted statistics e.g., runoff volumes
Incorporating climate change • information into the long-range planning • process of Seattle Public Utilities
Techniques to Incorporate Climate Change Impacts into Seattle’s Long-Range Water Supply Planning • Purpose: • Assess/develop techniques for incorporating climate change information into the long-range planning process of Seattle Public Utilities (SPU). • Demonstrate techniques by assessing potential impacts of climate change to the Seattle water supply.
Impacts of Climate Change in Seattle • Trend fit to all GCM points shows a decrease of ~6 MGD per decade in the system yield. • Substantial spread in the results from each GCM. • Incorporating impacts and uncertainty into the planning process
Single reach stream temperature model (from Sridhar et al, 2004)
Stream Temperature Model Simulating continuous flow and temperature data at un-monitored locations for use as habitat parameters in salmon population model. Flow at Taylor River Temp at Taylor River
Seasonal streamflow forecasts for utilities • in the Puget Sound basin
Graphic and tabular forecasts of streamflows into the water supply reservoirs on the Cedar, S.F. Tolt, Sultan and Green Rivers Probability of not exceeding given historic flow thresholds MONTH min 25th 50th 75th max 05/2005 0.69 1.00 1.00 1.00 1.00 06/2005 0.16 0.94 1.00 1.00 1.00 07/2005 0.16 0.72 0.90 0.99 1.00 08/2005 0.00 0.29 0.59 0.87 1.00 09/2005 0.00 0.10 0.26 0.61 1.00 10/2005 0.00 0.09 0.30 0.69 0.99 Ensemble predicted flows (cfs) at specified percentiles MONTH 1% 5% 10% 20% 30% 40% 50% 60% 70% 80% 90% 95% 99% 05/2005 75 98 101 119 128 144 150 159 171 193 215 247 290 06/2005 48 55 58 70 88 102 114 129 150 177 203 225 271 07/2005 35 38 44 48 56 61 65 72 77 93 109 129 206 08/2005 31 35 36 38 41 44 47 50 52 64 75 95 115 09/2005 35 39 39 44 55 63 72 83 92 122 175 187 313 10/2005 33 51 80 103 124 168 182 203 234 259 328 345 411
Mid-range Forecasts for Utilities in the Puget Sound • Web based delivery and e-mail distribution of pdf summary
Snohomish Utility Salmon Habitat Improvement Plan
SUSHI- Snohomish Utility Salmon Habitat Improvement Plan • Purpose: Examine the robustness of Chinook salmon recovery plans with the potential impacts of future climate change, climate variability, and land use changes in the Snohomish River Basin. • Goal: Choose the alternatives that most improve salmon populations. 2001 Land Use 2025 Current Path Land Use 2025 Restoration Path Land Use Location of the Snohomish River Basin
SUSHI- Snohomish Utility Salmon Habitat Improvement Plan • Accomplishments: • Climate model- 2 GCMs • Hydrologic model- DHSVM Model Linkages