Download
1 / 14
140 likes | 288 Views
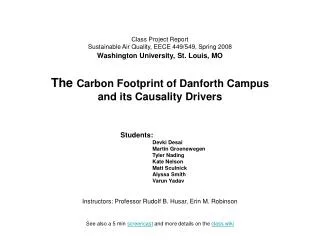
Washington University Danforth Campus Carbon Footprint: Using the Campus as a Living Laboratory. E. M. Robinson, R. B. Husar, M. Malten Washington University, St. Louis Contact: emr1@wustl.edu. Abstract.

E N D
Washington University Danforth Campus Carbon Footprint: Using the Campus as a Living Laboratory E. M. Robinson, R. B. Husar, M. MaltenWashington University, St. LouisContact: emr1@wustl.edu
Abstract Washington University, following the trend of many other academic institutions, performed a University-wide carbon emission footprint during the Spring of 2008 for 1990-2007. The carbon footprint was a collaborative effort between university facilities, an outside consultant and Prof. Husar, teaching EECE 449, Sustainable Air Quality. The collaboration was successful because of the excitement the students had about participating in work that was directly applicable to campus and the facilities department’s need for explanations about the cause of GHG emissions. The Sustainable Air Quality class narrowed the scope of the project to the Danforth Campus and focused on three main objectives: (1) develop a carbon footprint causality model; (2) estimate the carbon footprint and (3) compare our estimates to other universities carbon emission estimates. The Danforth campus saw over 50% increase in carbon emission from 1990 with 80% of that due to electricity usage. The class also found that the estimate for carbon emission on the Danforth campus was comparable to other universities that had performed similar footprint analysis. Future work will include using the carbon footprint causality model to explore various methods for carbon emission reduction.
Specific Objectives: • Develop and apply carbon emission estimation model • Estimate the carbon footprint of Danforth Campus • Establish the key causality drivers for the emissions The focus of this poster is on campus carbon emissions. Further work is still needed for transportation carbon estimates.
Campus as a Living Laboratory • The Sustainable Air Quality class, EECE 449/549 worked in collaboration with Facilities department and a consultant to establish a carbon footprint. • Using data collected by the consultant, the class with the consultants established the carbon emissions for the Danforth Campus. • The class contribution was to begin explaining carbon drivers, modeling future through scenarios and comparing our carbon estimate to peer institutions. • The class experience overall was positive. Students were engaged throughout the entire semester because the activities directly related to their lives.
Energy Use Overview On Campus Energy Use Heating The impact on carbon arises from on-campus energy use and from transportation Cooling Appliances Transportation Commuting Air Travel Students University Fleet Faculty/Staff
Method: Causality Model • Systems approach: linking human activities and their consequences in closed loop • Each component depends on its causal upstream driver – and external forcing • The causal loop can be used as an organizing principle for sustainability analysis
Building Area Projected • Student, Faculty Staff Population • Per Student Space • Teaching, research needs • Comfort? Projected Building Area/Student • Actual and Forecast Building Area New since 1990 Student Pop x Area/Student Building Area
Energy Demand Projected • Actual and Forecast Building Area • Building Energy Efficiency • Building Design • Appliances • Usage Pattern Projected Energy Use/Area • Actual and Forecast Energy Demand Area x Energy Use/Area Energy Use
Carbon Footprint Projected • Actual and Forecast Energy Demand • Carbon Emissions Factor • Fuel Mix • Energy Waste • Sequestration Projected Emission/Energy Use • Actual and Forecast Carbon Footprint Energy Use x Emission/Energy Use Emission
Discussion: • Carbon emission has increased by 60% from 1990-2005 • Increased building square footage and decreased energy efficiency has led to increased carbon emissions • By manipulating the energy efficiency or carbon efficiency reductions could be made.
Possible Future Activities • WU Carbon Footprint (Actual, Observations) • Transportation Carbon • (Electric) Energy Usage • Real-time monitoring • Carbon (Causality) Systems Model • Multi-science approach • Tool for testing ideas on Campus Carbon • Collaborate with other Universities in MAGEEP Network to improve carbon footprint
Acknowledgments • Washington University Facilities Department, particularly Ed Barry • Washington University Office of Sustainability, Matt Malten