Download
1 / 43
440 likes | 559 Views
LINEAR PROGRAMMING. FORMULATION AND GRAPHIC METHOD. DEFINITION. Mathematical technique for optimizing the use of constrained resources, where the relationship between variables is linear.

E N D
LINEAR PROGRAMMING FORMULATION AND GRAPHIC METHOD
DEFINITION • Mathematical technique for optimizing the use of constrained resources, where the relationship between variables is linear.
Linear – relationship between two or more variables which is directly and precisly proportional.Programming – refers to use of certain mathematical techniques to get the best possible solution to a given problem involving limited resources.
Basic Requirements • Decision variables and their relationships should be linear. • Objective function should be well defined • Presence of Constraints • Alternative course of action • Non negative restrictions • Linearity: Both Objective and Constraints must be expressed in Linear equations/inequalities.
Terminology • Decision variables – variables directly under the control of decision maker. • Objective function – An expression showing relationship between decision variables and organization's objectives. • Constraints – Limit or restriction on the availability of resources. • Non – negativity constraint – The decision variables must not assume negative values which is impossible situation. • Feasible region – The region which is common to all the constraints of given LPP.
Basic Solution – A solution of basic variables, where the values of non-basic variables are zero. • Feasible Solution – A solution satisfying all constraints and non-negativity restriction of a LPP. • Basic Feasible Solution – A basic solution, where the values of basic variables are non-negative. • Optimal Solution – A basic feasible solution which also optimizes the objective function.
Assumptions • Proportionality: • Proportionality/Linearity exists in Objective and Constraints • Additivity: • Total resources used must equal sum of resources used in individual activity • Divisibility: • Solution need not be whole numbers and may take up fractional value. • Certainty: • Co-efficients are known (Deterministic) • Finiteness: • Finite number of alternative solutions
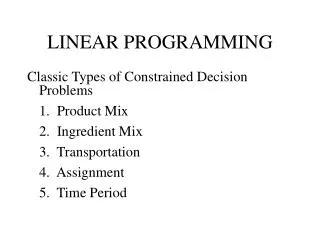
Applications of LPP • Industry • Product Mix • Production Smoothing • Blending • Production Scheduling • Trim Loss • Miscellaneous • Diet Problems • Farm Planning • Airline Routing • Facility Location • Management • Portfolio Selection • Financial Mix • Media Selection • Manpower Planning • Transportation • Job Allocation • Travelling Salesman
Problem Formulation • Problem formulation or modeling is the process of translating a verbal statement of a problem into a mathematical statement.
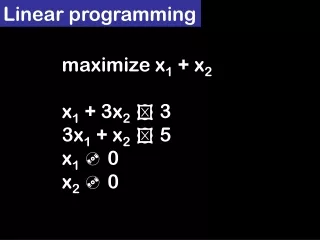
LP Model Formulation Max/min z = c1x1 + c2x2 + ... + cnxn subject to: a11x1 + a12x2 + ... + a1nxn (≤, =, ≥) b1 a21x1 + a22x2 + ... + a2nxn (≤, =, ≥) b2 : am1x1 + am2x2 + ... + amnxn (≤, =, ≥) bm xj = decision variables bi = constraint levels cj= objective function coefficients aij = constraint coefficients
Guidelines for Model Formulation • Understand the problem thoroughly. • Describe the objective. • Describe each constraint. • Define the decision variables. • Write the objective in terms of the decision variables. • Write the constraints in terms of the decision variables.
Linear Programming Problem • A firm producing 2 products P1 and P2. Each unit of P1 requires 1 kg material A, 2 kg of material B and 1 unit of labor. Each unit of P2 requires 3 kg of material B and 1 unit of labor. Each week firm has availability of 6 kg of material A, 19 kg of material B and 8 units of labor. One unit of P1 sold earn profit of Rs. 5 and P2 earns profit of Rs 7. How many units of each product is to be produced so as to give the maximum profit.
A Maximization Problem • LP Formulation Max Z = 5x1 + 7x2 (Profit function) s.t. x1< 6 (MaterialAConstraint) 2x1 + 3x2< 19 (MaterialBConstraint) x1 + x2< 8 (Labor Constraint) x1, x2> 0 (Non-negativity constraint)
Graphic Method of solving LPP • Formulate linear programming problem. • Each inequality in the constraints may be written as equality. • Plot the constraint lines considering them as equations. • Identify the feasible solution region. • Locate the corner points of the feasible region. • Calculate the value of objective function on the corner points. • Choose the point where the objective function has optimal value.
Graphical Solution x2 • Constraint #1 Graphed 8 7 6 5 4 3 2 1 1 2 3 4 5 6 7 8 9 10 x1< 6 (6, 0) x1
Graphical Solution x2 • Constraint #2 Graphed 8 7 6 5 4 3 2 1 1 2 3 4 5 6 7 8 9 10 (0, 6 1/3) 2x1 + 3x2< 19 (9 1/2, 0) x1
Graphical Solution x2 • Constraint #3 Graphed (0, 8) 8 7 6 5 4 3 2 1 1 2 3 4 5 6 7 8 9 10 x1 + x2< 8 (8, 0) x1
Graphical Solution x2 • Combined-Constraint Graph x1 + x2< 8 8 7 6 5 4 3 2 1 1 2 3 4 5 6 7 8 9 10 x1< 6 2x1 + 3x2< 19 x1
Graphical Solution x2 • Feasible Solution Region 8 7 6 5 4 3 2 1 1 2 3 4 5 6 7 8 9 10 Feasible Region x1
Example 1: Graphical Solution x2 • The Five Extreme Points 8 7 6 5 4 3 2 1 1 2 3 4 5 6 7 8 9 10 A B Feasible Region C E D x1
Evaluation of objective function at feasible region corner points Since Z has maximum value at point B (5,3), so x1 = 5, x2 = 3 Where profit is Rs 46.
Alternate Solution by extreme points x2 • Objective Function Line 8 7 6 5 4 3 2 1 1 2 3 4 5 6 7 8 9 10 (0, 5) Objective Function 5x1 + 7x2 = 35 (7, 0) x1
Alternate Graphical Solution x2 • Optimal Solution Objective Function 5x1 + 7x2 = 46 8 7 6 5 4 3 2 1 1 2 3 4 5 6 7 8 9 10 Optimal Solution (x1 = 5, x2 = 3) x1
Extreme Points and the Optimal Solution • The corners or vertices of the feasible region are referred to as the extreme points. • An optimal solution to an LP problem can be found at an extreme point of the feasible region. • When looking for the optimal solution, you do not have to evaluate all feasible solution points. • You have to consider only the extreme points of the feasible region.
Summary of the Graphical Solution Procedure for Maximization Problems • Prepare a graph of the feasible solutions for each of the constraints. • Determine the feasible region that satisfies all the constraints simultaneously. • Draw an objective function line. • Move parallel objective function lines toward larger objective function values without entirely leaving the feasible region. • Any feasible solution on the objective function line with the largest value is an optimal solution.
Minimization Problem Min Z = 5x1 + 2x2 Subject to constraints 2x1 + 5x2> 10 4x1 - x2> 12 x1 + x2> 4 x1, x2> 0
Graphical Solution • Graph the Constraints Constraint 1: When x1 = 0, then x2 = 2; when x2 = 0, then x1 = 5. Connect (5,0) and (0,2). The ">" side is above this line. Constraint 2: When x2 = 0, then x1 = 3. But setting x1 to 0 will yield x2 = -12, which is not on the graph. Thus, to get a second point on this line, set x1 to any number larger than 3 and solve for x2: when x1 = 5, then x2 = 8. Connect (3,0) and (5,8). The ">" side is to the right. Constraint 3: When x1 = 0, then x2 = 4; when x2 = 0, then x1 = 4. Connect (4,0) and (0,4). The ">" side is above this line.
Graphical Solution • Constraints Graphed x2 Feasible Region 5 4 3 2 1 4x1 - x2> 12 x1 + x2> 4 2x1 + 5x2> 10 1 2 3 4 5 6 x1
Graphical Solution • Graph the Objective Function Set the objective function equal to an arbitrary constant (say 20) and graph it. For 5x1 + 2x2 = 20, when x1 = 0, then x2 = 10; when x2= 0, then x1 = 4. Connect (4,0) and (0,10). • Move the Objective Function Line Toward Optimality Move it in the direction which lowers its value (down), since we are minimizing, until it touches the last point of the feasible region, determined by the last two constraints.
Graphical Solution Min z = 5x1 + 2x2 4x1 - x2> 12 x1 + x2> 4 • Objective Function Graphed x2 5 4 3 2 1 2x1 + 5x2> 10 1 2 3 4 5 6 x1
Graphical Solution • Solve for the Extreme Point at the Intersection of the Two Binding Constraints 4x1 - x2 = 12 x1+ x2 = 4 Adding these two equations gives: 5x1 = 16 or x1 = 16/5. Substituting this into x1 + x2 = 4 gives: x2 = 4/5
Solve for the Optimal Value of the Objective Function Solve for z = 5x1 + 2x2 = 5(16/5) + 2(4/5) = 88/5. Thus the optimal solution is x1 = 16/5; x2 = 4/5; z = 88/5
Graphical Solution Min z = 5x1 + 2x2 4x1 - x2> 12 x1 + x2> 4 • Optimal Solution x2 5 4 3 2 1 2x1 + 5x2> 10 Optimal: x1 = 16/5 x2 = 4/5 1 2 3 4 5 6 x1
Special Cases • Multiple Optimal Solutions • Infeasible problem • Unbounded problem • Redundant Constraint
Multiple optimal solutions • If objective function falls on more than one optimal point, the solution is said to be multiple optimal. • It exists when slope of the objective function and one of the constraint equation are same.
Infeasible problem • No feasible solution. • It means there are no points that simultaneously satisfy all constraints in the problem. • Common region do not develop in the first quadrant. • Objective function do not pass through any point of all constraints.
Example of Infeasible Problem Max Z = 2x1 + 6x2 subject to constraints 4x1 + 3x2< 12 2x1 + x2> 8 x1, x2> 0
Infeasible Problem • There are no points that satisfy both constraints, hence this problem has no feasible region, and no optimal solution. x2 2x1 + x2> 8 8 4x1 + 3x2< 12 4 x1 3 4
Unbounded Problem • When feasible solution space formed by the constraints is not confined to the first quadrants only. • If constraints passes through 2nd, 3rd or 4th quadrant. • No limits on the constraints. • Common feasible region is not bounded in any respect.
Example of Unbounded Problem Max Z = 3x1 + 4x2 subject to x1 + x2> 5 3x1 + x2> 8 x1, x2> 0
Unbounded Problem • The feasible region is unbounded and the objective function line can be moved parallel to itself without bound so that z can be increased infinitely. x2 3x1 + x2> 8 8 Max 3x1 + 4x2 5 x1 + x2> 5 x1 2.67 5
Redundant Constraint • When one constraint is less restrictive than other constraint, it is said to be redundant constraint.