Download
1 / 16
160 likes | 412 Views
www.radstats.org.uk Statistics for a change Social responsibility in statistics. The effect of the cuts on government statistics and their use. Radical Statistics’ working group on Reduced Statistics RSS conference, Telford, 5 Sept 2012. UK official statistics: development.

E N D
www.radstats.org.uk Statistics for a change Social responsibility in statistics The effect of the cuts on government statistics and their use Radical Statistics’ working group on Reduced Statistics RSS conference, Telford, 5 Sept 2012
UK official statistics: development • Army and taxation • WWII created the CSO • Expansion of GSS in the 1970s • Rayner Review and contraction 1980s • 1990s-2000s expansion • Legislation and its impact
Purposes of official statistics? • Appraisal and evaluation of policies by civil servants and those working on government's behalf • To support 'enterprise', 'knowledge', 'innovation' - statistics used for things from market to fundamental academic research • Democratic accountability for the outcomes of policy, providing a basis for debate in the public sphere (for NGOs, think tanks, political parties or movements)
Measuring the production of statistics • Inputs (expenditure) • Staffing • Activity (publications, series, surveys) • Quality • Effectiveness
Expenditure • Comprehensive Spending Review 2010/11- 2014/15: reduce public expenditure in response to national economic debt • Impossible to identify government spending on Statistics or Research • John Beddington to House of Lords Nov 2011: “has involved a team working for about four or five months to get as far as we have, and I have to question the allocation of resources”. • DfID commissioned research +59% 2010/11 to 2014/15 • DEFRA commissioned research -21% 2010/11 to 2014/15 • DWP commissioned research -20% in one year to 2011/12 • DCLG commissioned research -63% 2008/09 to 2011/12 • Research Council spending -10% over 4 years in real terms
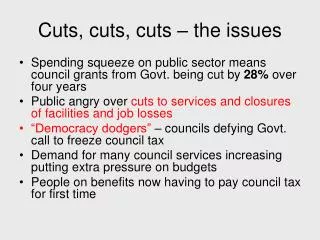
Expenditure – local government • Budget 2011/12 : 10% below the out-turn in 2009/10 (IFS, 2012). • larger authorities serving the poorest areas suffering larger cuts • In half, Development and Planning functions cut by 40% or more • “monitoring and evaluation roles appear to be one of the foremost casualties of back office efficiencies in many, if not all, authorities”. • “important implications for the development of an evidence base capable of facilitating understanding of the scale and impact of budget contraction.” Hastings et al., 2012, based on budget documents and interviews • Half of local authority researchers experienced budget drops in their department in both 2010/11 and 2011/12 (LARIA/PMN, 2012) • Of the drops each year, a quarter are severe rather than moderate. • “Achieving more with less” • Greatest challenge in 2011 (52%) and 2012 (42%)
Staffing • A four-way table: • Economists – Statisticians – Operational Researchers – Researchers • Full time equivalent staff in each Government Department • March 2009, 2010, 2011, 2012, and estimated for current financial year • a) below Grade 6 level, b) at Grade 6 or above
Staffing: Government Statisticians, Economists, Social Researchers Add 60-80 for SCS (Senior Civil Servants) Economists Social Researchers Source: UKSA Committee on Official Statistics; headcounts
Activity • The TellUs Survey (Schools) • children and young people's views and self-reported behaviour • The Citizenship Survey (DCLG) • race equality, faith, feelings about their community, volunteering and participation • The Place Survey (DCLG) • National indicator set for evaluating local government performance • Statistical series • All regional reporting by DCLG, the Electronic Survey of Empty Homes, Neighbourhood Statistics on Vacancies and Second Homes, and dwelling stock by Council Tax Band, Houses in Multiple Occupation, … • UKSA note cessations reported to the National Statistician
Reduction in Economy and Government oddly more than reported as deleted. Reduction in ad hoc analyses: 157 -> 120 -> 46
Quality • Planned reductions in quality • Sample size of eg. household conditions survey • The unplanned impact of reduced staff • Checks and validation • Engagement (morale) – Civil Service survey • Reorganisations have tended to interrupt and de-skill services • Voluntary redundancy schemes tend to take the more experienced staff
Effectiveness • Economic impact (Charles Beagrie Ltd & CSES, 2012) • The effects of withdrawing a service • ‘How much would you accept to not have this service?’ • The results valued the ESRC’s Economic and Social Data Service at five times more than the investment made to fund them. • How to weight the opinions of different users? • The occasional user of benefit take-up statistics who finds them essential • I think: not of practical help in the short term
Some features • Easiest pruning • Commissioned research including surveys • Political hits – previous administration’s projects • Analysis rather than staff or core data • Also the profession’s strategy to ‘retain capacity’ • Coalition philosophy • Localism, let others do government, monitor themselves • Away with targets (setting them and missing them) • A market of services: led by demand not neediness • Variation in impact • Government department DfID, MoD ↑, CLG, DWP, DfES, DEFRA ↓ • Local Government variation in decreases
William Farr 1807-1885 First ‘compiler of abstracts’ at General Register Office after civil registration began in England and Wales in 1837. Wrote commentaries on trends in births, deaths and population. Developed classifications of diseases and causes of death. ONS business plan 2012: Health analysis no longer a priority
What to expect – medium term • Data without interpretation • Reduction in analysis • Open Data without validation • Vulnerable reputation of official statistics • Diversity of state provision • Incompleteness and variety of administrative data • Standards, co-ordination, responsibility to self-monitor? • Cumulative impact on democratic accountability • Equality agenda without benefit statistics take-up analyses • Public order agenda with reduced regional and local statistics • Resignations at UKSA www.radstats.org.uk Statistics for a change Social responsibility in statistics