Download
1 / 20
200 likes | 322 Views
Theory of Predicting Crop Response to Non-Limiting Nitrogen. What do N Rich Strips Say About N Rate Algorithms? + Quite a Bit of Geostatistics. What do N Rich Strips Say About N Rate Algorithms? – Part II, with a little geostatistics. Nitrogen Rich Strip.

E N D
What do N Rich Strips Say About N Rate Algorithms? + Quite a Bit of Geostatistics
What do N Rich Strips Say About N Rate Algorithms? – Part II, with a little geostatistics
Nitrogen Rich Strip Apply one Non-Limiting Nitrogen strip across the field between preplantfertilization and shortly after emergence. Use this as a reference strip to determine N rate. Concept first proposed in 1994by Dr. James Schepers
NRich (N Reference) Strip Enables Paired Comparison of Field Practice N Fertility and Non-Limiting N Fertility Paired sampling of N Rich and Field Rate NDVI from either IKONIS or GreenSeeker imagery Measure Nrich NDVI and calculate expected yield Measure Field Rate NDVI
How Should We Interpret RINDVI • In 2007, we examined RINDVI indirectly by transforming the data to potential yield • This year, I will examine RINDVI directly and compare measured RI to RI predicted by the OSU algorithm • The goal of this is to: • Better understand the relationship between FpNDVIand RINDVI • provide a method for evaluating algorithms based on measured paired comparisons of vegetative growth through part of the season
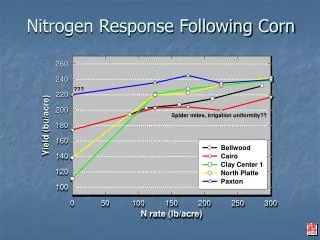
Comparison of RI Curves Constructed from NRich Strips and Field Experiments
RI NDVI Corn Model Calculated from Field Averages of FpNDVI and NRich NDVI
Yield Potential Model for All CropsWheat Data Shown in Graph
Comparison of OSU Topdress Rate to RI NDVI Model Topdress Rate ?
Semivariogram Region where samples remain correlated (i.e. integral scale) or region of high relatedness Indication of spatial strength. Integral Scale Overall sample variance. Measure of undetermined small scale variability and sampling error. Distance “range” where data is spatially related.
Recommendations for Measuring RI NDVI • Pair your farmer practice treatment and your NRich treatments in your experiment design or (in the case of statistical purists) insert an extra farmer practice treatment which is paired with your NRich treatments. • To maximize spatial relatedness, your sensor measurements from the two treatments should be spaced no more than three to four meters apart. • At greater distances, relatedness declines and variability (error) in the value of RI increases. • Remember that beyond the range measurements can be highly related by chance. Between the integral scale and the range, the odds of the measurements being highly related declines rapidly.
Conclusions • Paired comparisions between field N rate and non-limiting N rate along an NRich strip define the relationship between the existing and optimum N application rate. • All algorithms purporting to determine N application rate must account for the relationships between FpNDVI and NRich NDVI defined by the NRichstrip. • These relationships vary from year to year and location to location. • The Power/Cosh model appears to accurately predict the NDVI Response Index as a function of FpNDVI.