Download
1 / 39
390 likes | 572 Views
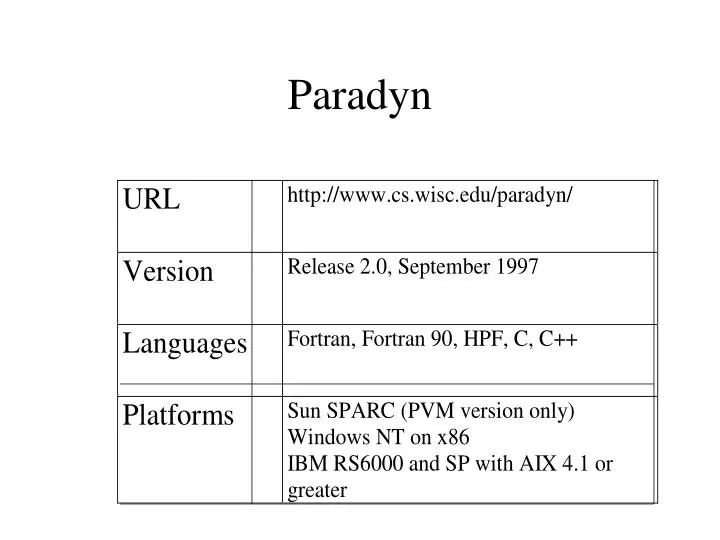
Paradyn. Paradyn Goals. Performance measurement tool that scales to long-running programs on large parallel and distributed systems automates much of the search for performance bottlenecks avoids space and time overhead of trace-based tools. Paradyn Approach.

E N D
Paradyn Goals • Performance measurement tool that • scales to long-running programs on large parallel and distributed systems • automates much of the search for performance bottlenecks • avoids space and time overhead of trace-based tools
Paradyn Approach • Dynamically instrument application • Automatically control instrumentation in search of performance problems • Look for high level problems (e.g., too much synchronization blocking, I/O blocking, or memory delays) using small amount of instrumentation • Once general problem is found, selectively insert more instrumentation to find specific causes
Paradyn Components • Front end and user interface that allow user to • display performance visualization • use the Performance Consultant to find bottlenecks • start and stop the application • monitor status of the application • Paradyn daemons • monitor and instrument application processes • pvmd, mpid, winntd
Using Paradyn • Program preparation: • Future releases will be able to instrument unmodified binary files • Current release 2.0 requires linking applications with Paradyn instrumentation libraries • Static linking is required on IBM AIX platforms • Application must be compiled with -g flag
Paradyn Run-time Analysis • Paradyn is designed to either start up application processes and kill them upon exit, or to attach to and detach from running (or stopped) processes. • Attaching to a running process is currently implemented on Solaris. • Paradyn currently does not detach but only kills upon exit.
Metric-Focus Pairs • Metric-focus grid based on two vectors • list of performance metrics (e.g., CPU time, blocking time, message rates, I/O rates) • list of program components (e.g., procedures, processes, message channels, barrier instances) • Cross product forms matrix from which user selects metric-focus pairs • Elements of matrix can be single-valued (e.g., current value, average, min, max) or time-histograms • Time-histogram is a fixed size data structure that records behavior of a metric over time
“Where” Axis • After loading program, Paradyn adds entries for program resources to Where Axis window • files • procedures • processes • machines
Performance Visualizations • Before or while running a program, the user can define performance visualizations in terms of metric-focus pairs • select focus from Where Axis • select metrics from Metrics Dialog Box • select visualization from Start Visualization Menu
Paradyn Phases • Contiguous time intervals within an application’s execution • Two kinds • global phase starts at beginning of program execution and extends to current time • local phases non-overlapping subintervals of the global phase
Paradyn Phases (cont.) • Data collection for new phase occurs at finer granularity than for global phase. • Visualizations can show data for either local phase or global phase. • Performance Consultant can simultaneously search both local phase and global phase.
Performance Consultant • Based on W3 Search Model • “Why” - type of performance problems • “Where” - where in the program these problems occur • “When” - time during execution during which problems occur
Performance Consultant (cont.) • Automatically locates potential bottlenecks in your application • Contains definitions of a set of performance problems in terms of hypotheses - e.g., PerfMetricX > Specified Threshold • Continually selects and refines which performance metrics are enabled and for which foci • Reports bottlenecks that exist for significant portion of phase being measured
Why Axis TopLevelHypothesis ExcessiveSyncWaitingTime CPUBound ExcessiveIOBlockingTime TooManySmallIOOps
Why Axis (cont.) • CPUBound: Compares CPU time to the tunable constant PC_CPUThreshold • ExcessiveSyncTime: Compares total synchronization waiting time to the tunable constant PC_SyncThreshold • ExcessiveIOBlockingTime: Compares total I/O waiting time to the tunable constant PC_IOThreshold • TooManySmallIOOps: Compares average number of bytes per I/O operation to PC_IOThreshold
Search History Graph • DAG with (hypothesis : focus) pairs as nodes • Top node represents (TopLevelHypothesis : WholeProgram) • Child nodes represent possible refinements • Search is expanded dantime a (hypothesis : focus) pair tests true
Search History Graph (cont.) • Node status given by color • green background indicates Unknown status • white foreground indicates active test • pink background indicates hypothesis tested false • blue background indicates hypothesis tested true • yellow line represents Why Axis refinement • purple line represents Where Axis refinement
Tunable Constants • PC_CPUThreshold: used for hypothesis CPUBound • PC_SyncThreshold: used for hypothesis ExcessiveSyncWaitingTime • PC_IOThreshold: used for hypothesis ExcessiveIOBlockingTime • MinObservationTime: all tests will be continued for at least this interval of time before any conclusions are drawn. • costLimit: determines an upper bound on the total amount of instrumentation that can be active at a given time.
Visualization Modules (visi’s) • External processes that use VisiLib RPC interface to access performance data in real time • Visi’s provided with Paradyn • time-histogram • bar chart • table • 3-d terrain
Dyninst API • http://www.cs.umd.edu/~hollings/dyninstAPI • Machine-independent interface for runtime program instrumentation • Insertion and removal of instrumentation code into and from running processes • Process and OS independent specification of instrumentation code • C++ library interface • Can be used to build debuggers, performance measurement tools, simulators, and computation steering systems
Dyninst API (cont.) • Currently supported platforms • SPARC SunOS and Solaris • x86 Solaris and NT • IBM AIX/SP • DEC Alpha • Planned for near future • SGI Origin 2000
Dyninst Terminology • point - location in a program where instrumentation can be inserted • snippet - representation of a bit of executable code to be inserted into a program at a point • e.g., To record number of times a procedure is invoked: • point - first instruction in the procedure • snippet - statement to increment a counter
Dyninst Terminology (cont.) • thread - thread of execution, which may be a normal process or a lightweight thread • image - static representation of a program on disk • application - process being modified • mutator - program that uses the API to modify the application
Using the dyninst API • Declare single object of class Bpatch • Identify application process to be modified • appThread = bpatch.createProcess(pathname, argv); • appThread = bpatch.attachProcess(pathname, processId) • Define snippet and points where it should be inserted
Dyninst Example Bpatch_image *appImage; Bpatch_Vector(Bpatch_point*) *points; // Open the program image associated with the thread and return a handle to it. appImage = appThread->getImage(); // find and return the entry point to the “InterestingProcedure”. Points = appImage->findProcedurePoint(“InterestingProcedure”, Bpatch_entry); // create a counter variable (but first get a handle to the correct type). Bpatch_variableExpr *intCounter = appThread->malloc(*appImage->findType(“int”)); // create a code block to increment the integer by one. // intCounter = intCounter + 1 // Bpatch_arithExpr addone(Bpatch_assign, *intCounter, Bpath_arithExpr(Bpatch_plus, *intCounter, Bpatch_constExpr(1))); // insert the snippet of code into the application. appThread->insertBlock(addone, *points);
DAIS • Dynamic Application Instrumentation System • Proposed by Douglas Pase at IBM • Platform-independent client-server library for building debugging and performance tools • Based on dyninst
DAIS (cont.) • Support proposed for • code patches • periodic instrumentation • inferior remote procedure calls (IRPCs) • remote memory reads and writes • dynamic subroutine placement • process control for debugging • Planned demo tools • dynamic printf • trace capture for MPI