Download
1 / 37
390 likes | 552 Views
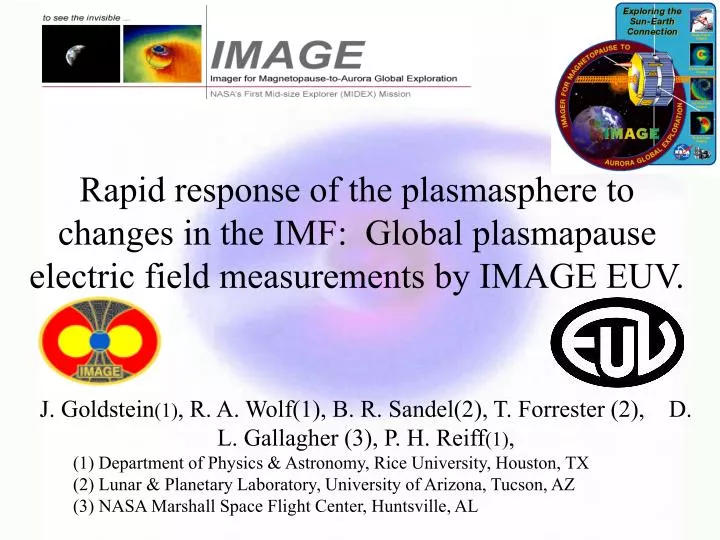
Rapid response of the plasmasphere to changes in the IMF: Global plasmapause electric field measurements by IMAGE EUV. J. Goldstein (1) , R. A. Wolf(1), B. R. Sandel(2), T. Forrester (2), D. L. Gallagher (3), P. H. Reiff (1) ,

E N D
Rapid response of the plasmasphere to changes in the IMF: Global plasmapause electric field measurements by IMAGE EUV. J. Goldstein(1), R. A. Wolf(1), B. R. Sandel(2), T. Forrester (2), D. L. Gallagher (3), P. H. Reiff(1), (1) Department of Physics & Astronomy, Rice University, Houston, TX (2) Lunar & Planetary Laboratory, University of Arizona, Tucson, AZ (3) NASA Marshall Space Flight Center, Huntsville, AL
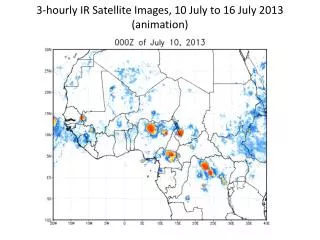
Plasmaspheric Erosion: July 10, 2000 July 10, 2000 (day 192) MOVIE Nightside erosion 5:16-5:37 UT and 6:28-7:50 (ABOVE) EUV images from observed interval of plasmaspheric erosion.
Plasmaspheric Erosion July 10, 2000 (day 192) MOVIE MOVIE Nightside erosion 5:16-5:37 UT and 6:28-7:50 (ABOVE) EUV images from observed interval of plasmaspheric erosion.
Erosion of nightside plasmasphere July 10, 2000 (day 192) AFTER BEFORE Erosion: 5:16-5:37 UT and 6:28-7:50 During the times indicated, the plasmasphere was observed to shrink visibly.
Erosion of nightside plasmasphere July 10, 2000 (day 192) What are the associated E-fields? BEFORE AFTER Erosion: 5:16-5:37 UT and 6:28-7:50 (ABOVE) The plasmapause shapes from the EUV images have been mapped down to the magnetic equatorial plane. The effect of erosion is evident in the difference between the “BEFORE” and “AFTER” plots.
Plasmaspheric Erosion July 10, 2000 (day 192) What are the associated E-fields? MOVIE • Need to track motion of the plasmapause Nightside erosion 5:16-5:37 UT and 6:28-7:50 (ABOVE) EUV images from observed interval of plasmaspheric erosion.
Plasmapause Tracking Goal: Follow “radial” motion
Plasmapause Tracking Goal: Follow “radial” motion Velocity plasmapause 0.1 RE uncertainty in the tracking.
Nightside Erosion: What are we measuring? nightside erosion
Electric Field Extraction First we calculate the velocity of a given point, using centered time differencing. Second-Order Finite-Difference Then we get Electric Field E=-v X B. (Assume dipole B)
Two error sources from “euv_imtool” (1) manual centering (2) manual “clicking” on the p’pause Error Sources (3) Error from shape tracking algorithm. (ABOVE) Snapshot from “euv_imtool”, the U. Arizona IDL code used to extract plasmapauses from the EUV data, and map them down to the magnetic equator. Total Error • If dX ~ 0.1 RE, then dV~V (comparable). These 3 errors add up to “positional” uncertainty of ~0.1 RE per 10 minutes. Unfortunately, this isn’t much smaller than the flows we wish to measure. The E-field measurements are therefore noisy, until we can polish the extraction and shape tracking routines.
Convection and Nightside Erosion July 10, 2000
Convection and Nightside Erosion July 10, 2000
Convection and Nightside Erosion July 10, 2000 (TOP PLOT) 2D plot of Westward E-field vs. MLT and UT. Enhanced dawn-to-dusk E-field is concentrated in the pre-dawn sector
Convection and Nightside Erosion July 10, 2000 (TOP PLOT) 2D plot of Westward E-field vs. MLT and UT. Enhanced dawn-to-dusk E-field is concentrated in the pre-dawn sector, and occurs in two bursts. 5:16-5:37 6:28-7:50
Convection and Nightside Erosion July 10, 2000 (BOTTOM PLOT) Geotail BZ IMF There are two corresponding bursts of southward IMF, which presumably triggered the convection. The Geotail data has been time shifted by 6.5 minutes to account for propagation, and an additional 30 minutes, which might be “reconfiguration time.”
Convection and Nightside Erosion July 10, 2000 sample here TheEastward E-field[in units of mV/m X 10] is overlaid on the time-shiftedGeotail BZ IMF _____________________________ The agreement between the two is quite good.
Convection and Nightside Erosion 1. Post-midnight E-concentration (PMEC) 2. Close correspondence with delayed IMF
Plasmaspheric Erosion II: June 2, 2001 June 2, 2001 (day 153) MOVIE Nightside erosion 00:54-2:05 UT and 4:18-5:09
Plasmaspheric Erosion II: June 2, 2001 June 2, 2001 (day 153) 1. Post-midnight E-concentration (PMEC)
Plasmaspheric Erosion II: June 2, 2001 June 2, 2001 (day 153) 1. Post-midnight E-concentration (PMEC) 2. Close correspondence with delayed IMF
Penetration E-Fields: IM Shielding E-conv decreases: Tailward plasma flow in inner msphere Overshielding (antisunward flow) Shielding E-conv picks up: Sunward plasma flow in inner msphere E-shielding exactly cancels E-convection Undershielding (sunward flow)
Overshielding E-conv decreases: Tailward plasma flow in inner msphere Overshielding (antisunward flow) Shielding E-shielding exactly cancels E-convection
Overshielding: MSM Electric Fields PMEC “dawnside eddy”
Overshielding: Plasmaspheric Shoulder Outward flow here Corotation to here
Undershielding E-conv picks up: Sunward plasma flow in inner msphere Shielding E-shielding exactly cancels E-convection Undershielding (sunward flow) 18:45
March 19, 2001 biteout “Bite-out” PMEC Bite-out Bite-out forms MSM density, day 78, 18:45 MSM pot., day 78, 18:45 18:45
March 20, 2001 (cont.) “Bite-out” MSM density, day 79, 00:30 EUV image, day 79, 00:35 Bite-out drainage tail Bite-out drainage tail Bite-out forms 00:35
March 20, 2001 (cont.) “Biteout” MSM density, day 79, 2:45 EUV image, day 79, 2:38 Bite-out drainage tail Bite-out drainage tail Bite-out forms 2:38
EUV and the dawnside eddy “dawnside eddy”
MSM-EUV comparison MOVIE
(1) EUV permits limited extraction of E-fields (or velocity fields). Conclusions (2) EUV E-fields, MSM simulations together: (a) rapid response of PS to IMF (b) PMEC leads to formation of shoulders, bite-outs