Download
1 / 1
10 likes | 159 Views
Ozone Lidar Measurements in the Boundary Layer AGU Session: Green House Gas Measurements using Active Optical Remote Sensing, A53H-0239. Shi Kuang 1 , Mike Newchurch 1 , John Burris 2 , Wesley Cantrell 1 , Guanyu Huang 1 1 U. Of Alabama in Huntsville, 2 NASA/GSFC.

E N D
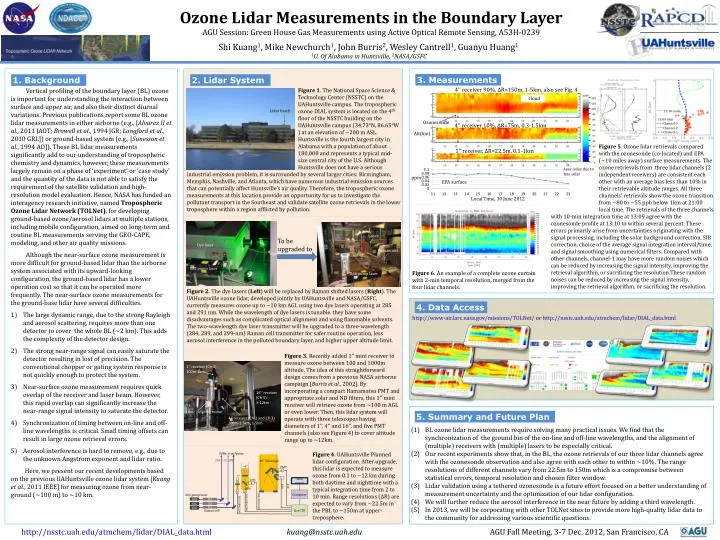
Ozone Lidar Measurements in the Boundary Layer AGU Session: Green House Gas Measurements using Active Optical Remote Sensing, A53H-0239 Shi Kuang1, Mike Newchurch1, John Burris2, Wesley Cantrell1, Guanyu Huang1 1U. Of Alabama in Huntsville, 2NASA/GSFC Vertical profiling of the boundary layer (BL) ozone is important for understanding the interaction between surface and upper air, and also their distinct diurnal variations. Previous publications report some BL ozone lidar measurements in either airborne (e.g., [Alvarez II et al., 2011 JAOT; Browell et al., 1994 JGR; Langford et al., 2010 GRL]) or ground-based system (e.g., [Sunesson et al., 1994 AO]). These BL lidar measurements significantly add to our understanding of tropospheric chemistry and dynamics, however, these measurements largely remain on a phase of ‘experiment’ or ‘case study’ and the quantity of the data is not able to satisfy the requirement of the satellite validation and high-resolution model evaluation. Hence, NASA has funded an interagency research initiative, named Tropospheric Ozone Lidar Network (TOLNet), for developing ground-based ozone/aerosol lidars at multiple stations, including mobile configuration, aimed on long-term and routine BL measurements serving the GEO-CAPE, modeling, and other air quality missions. Although the near-surface ozone measurement is more difficult for ground-based lidar than the airborne system associated with its upward-looking configuration, the ground-based lidar has a lower operation cost so that it can be operated more frequently. The near-surface ozone measurements for the ground-base lidar have several difficulties. The large dynamic range, due to the strong Rayleigh and aerosol scattering, requires more than one detector to cover the whole BL (~2 km). This adds the complexity of the detector design. The strong near-range signal can easily saturate the detector resulting in lost of precision. The conventional chopper or gating system response is not quickly enough to protect the system. Near-surface ozone measurement requires quick overlap of the receiver and laser beam. However, this rapid overlap can significantly increase the near-range signal intensity to saturate the detector. Synchronization of timing between on-line and off-line wavelengths is critical. Small timing offsets can result in large ozone retrieval errors. Aerosol interference is hard to remove, e.g., due to the unknown Angstrom exponent and lidar ratio. Here, we present our recent developments based on the previous UAHuntsville ozone lidar system [Kuang et al., 2011 IEEE] for measuring ozone from near-ground (~100 m) to ~10 km. 3. Measurements 1. Background 2. Lidar System Figure 1. The National Space Science & Technology Center (NSSTC) on the UAHuntsville campus. The tropospheric ozone DIAL system is located on the 4th floor of the NSSTC building on the UAHuntsville campus (34.73°N, 86.65°W ) at an elevation of ~200 m ASL. Huntsville is the fourth largest city in Alabama with a population of about 180,000 and represents a typical mid-size central city of the U.S. Although Huntsville does not have a serious 4’’ receiver 90%, ΔR=150m, 1-5km, also see Fig. 4 cloud Lidar hatch Ozonesonde 4’’ receiver 10%, ΔR=75m, 0.3-1.5km Alt(km) Figure 5. Ozone lidar retrievals compared with the ozonesonde (co-located) and EPA (~10 miles away) surface measurements. The ozone retrievals from three lidar channels (2 independent receivers) are consistent each other with an average bias less than 10% in their retrievable altitude ranges. All three channels’ retrievals show the ozone transition from ~80 to ~55 ppb below 1km at 21:00 local time. The retrievals of the three channels 1’’ receiver, ΔR=22.5m, 0.1-1km Less noise due to less solar industrial emission problem, it is surrounded by several larger cities: Birmingham, Memphis, Nashville, and Atlanta, which have numerous industrial emission sources that can potentially affect Huntsville’s air quality. Therefore, the tropospheric ozone measurements at this location provide an opportunity for us to investigate the pollutant transport in the Southeast and validate satellite ozone retrievals in the lower troposphere within a region afflicted by pollution. 13:10 sonde ppm 13:09 lidar EPA surface Channel-3 Channel-2 + + Channel-1 Local Time, 30 June 2012 with 10-min integration time at 13:09 agree with the ozonesonde profile at 13:10 to within several percent. These errors primarily arise from uncertainties originating with the signal processing, including the solar background correction, SIB correction, choice of the average signal integration interval/time, and signal smoothing using numerical filters. Compared with other channels, channel-1 may have more random noises which can be reduced by increasing the signal intensity, improving the retrieval algorithm, or sacrificing the resolution.These random noises can be reduced by increasing the signal intensity, improving the retrieval algorithm, or sacrificing the resolution. Gases To be upgraded to Dye laser Raman cell Manifold 532 pump laser Figure 6. An example of a complete ozone curtain with 2-min temporal resolution, merged from the four lidar channels. 266 pump laser Figure 2. The dye lasers (Left) will be replaced by Raman shifted lasers (Right). The UAHuntsville ozone lidar, developed jointly by UAHuntsville and NASA/GSFC, currently measures ozone up to ~10 km AGL using two dye lasers operating at 285 and 291 nm. While the wavelength of dye lasers is tunable. they have some disadvantages such as complicated optical alignment and using flammable solvents. The two-wavelength dye laser transmitter will be upgraded to a three-wavelength (284, 289, and 299-nm) Raman cell transmitter for safer routine operation, less aerosol interference in the polluted boundary layer, and higher upper altitude limit. 4. Data Access http://www-air.larc.nasa.gov/missions/TOLNet/or http://nsstc.uah.edu/atmchem/lidar/DIAL_data.html Figure 3. Recently added 1’’ mini receiver to measure ozone between 100 and 1000m altitude. The idea of this straightforward design comes from a previous NASA airborne campaign [Burris et al., 2002]. By incorporating a compact Hamamatsu PMT and appropriate solar and ND filters, this 1’’ mini receiver will retrieve ozone from ~100 m AGL or even lower. Then, this lidar system will operate with three telescopes having diameters of 1’’, 4’’ and 16’’, and five PMT channels (also see Figure 4) to cover altitude range up to ~12km. 30Hz, 6 mJ/pulse 284 299 289 16” Telescope 4” PMT 5. Summary and Future Plan 4 (1) BL ozone lidar measurements require solving many practical issues. We find that the synchronization of the ground bin of the on-line and off-line wavelengths, and the alignment of (multiple) receivers with (multiple) lasers to be especially critical. (2) Our recent experiments show that, in the BL, the ozone retrievals of our three lidar channels agree with the ozonesondeobservation and also agree with each other to within ~10%. The range resolutions of different channels vary from 22.5m to 150m which is a compromise between statistical errors, temporal resolution and chosen filter window. Lidarvalidation using a tethered ozonesonde is a future effort focused on a better understanding of measurement uncertainty and the optimization of our lidar configuration. We will further reduce the aerosol interference in the near future by adding a third wavelength. In 2013, we will be corporating with other TOLNet sites to provide more high-quality lidar data to the community for addressing various scientific questions. 1’’ receiver (Ch-1) 100m-1km 1” 5 10% Web server 2 299 289 Figure 4. UAHuntsville Planned lidar configuration. After upgrade, this lidaris expected to measure ozone from 0.1 to ~12 km during both daytime and nighttime with a typical integration time from 2 to 10 min. Range resolutions (ΔR) are expected to vary from ~22.5m in the PBL to ~150m at upper-troposphere. 90% 16’’ receiver (Ch-5) 3-12km 1 3 Computer 283/289/299 266 pump laser 283/289/299 283/289/299 YAG N2 Laser outgoing mirror YAG D2 4’’ receiver (Ch-2 and Ch-3) 300m-1.5km, 1-5km Licel TR YAG H2 Raman cell http://nsstc.uah.edu/atmchem/lidar/DIAL_data.htmlkuang@nsstc.uah.edu AGU Fall Meeting, 3-7 Dec. 2012, San Francisco, CA