Download
1 / 48
480 likes | 615 Views
Health Needs Assessment for the Latino Population of Nevada. Sherry Liao, MPH Candidate University of Nevada, Reno April 17 , 2014. citizenship.honeywell.com.

E N D
Health Needs Assessment for the Latino Population of Nevada Sherry Liao, MPH Candidate University of Nevada, Reno April 17, 2014
citizenship.honeywell.com As diversity in the United States continues to increase, a variety of outreach methods are needed to reach all segments of the population.
Health Disparities Faced by Latinos • Obesity1 • Hypertension2 • Diabetes3 • HIV/AIDS4 • Breast cancer detection, treatment, and follow-up5 • Colorectal cancer screening6 • Mental health7 growthhormonecanada.ca
Lack of Access to Care • Language Barrier8 • Lack of cultural competence9 • Mistrust9 • Low Educational Attainment8 • Unable to navigate system9 • Immigration status8 www.alphasandesh.com
47% of Hispanics in Nevada lack access to care.8 myfertilitychoices.com
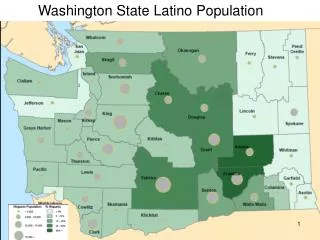
From 2000 to 2011, the Latino population in the United States grew 47.5%.10 During that same time period, the Latino population in Nevada grew 66.0%.10 bionutritionalresearch.olhblogspace.com
Nevada presents unique challenges in accessing healthcare. pubs.usgs.gov
Community Health Worker Program CHW Program
Methods • Latino Health Needs Assessment (LHNA) Survey • 76 questions • Topics • General demographics • Access to healthcare • Chronic diseases • Health screenings • Health behaviors • Reproductive health • Mental health • Community factors • Development mexicoinstitute.wordpress.com mexicoinstitute.wordpress.com
Methods • Latino Health Needs Assessment • Data collection: July 2013 – November 2013 • Formats • Paper and Electronic • English and Spanish (72.8% Spanish) • Incentives ($25 gift cards) • Participant Recruitment • Inclusion Criteria mexicoinstitute.wordpress.com
Methods • Data Analysis • Data cleaning • 3 excluded due to age • 3 excluded due to ethnicity • Invalid and out-of-state zip code excluded from county analysis • Final sample: N = 933 • Combining free response answers • Ex. Please specify your type of employment.
Over a quarter of respondents (26.8%) reported an annual household income of less than $10,000 and well over half (62.3%) reported one of less than $30,000. http://eofdreams.com/photo/money/11/ N = 855
Only 22.2% and 19.0% of respondents reported receiving benefits from WIC and SNAP, respectively, in the past year. N = 864
Only about one in four respondents had healthcare coverage of any kind. N = 890
Of respondents who have children, 93.6% reported that all their children were up to date on their immunizations. N = 484 www.smchealth.org
Most respondents (61.9%) reported that they had a place to go if sick or needed health advice. www.negotiationlawblog.com N = 872
Have you ever felt discriminated against by a healthcare provider due to any of the following?
Physical and Mental Health N = 907 & 854, respectively
Calculated versus Self-Reported BMI Classifications N = 865 & 688, respectively
About half of respondents (50.35%) reported participating in physical activity in the past month outside of their job. www.ymcanyc.org N = 850
Over a third (36.7%) of respondents had cut the size of their or their family’s meals because there was not enough food. N = 842 www.sodahead.com
About a quarter of respondents (25.4%) said it was difficult for them to eat healthy foods. (N = 839) sathiyam.tv Over a third of respondents (36.0%) said it was difficult for them to exercise.(N = 850) www.thehealthytrucker.net
Breast Cancer Screenings * Women over age 40
Colorectal Screenings * All respondents over age 50
Colorectal Screenings * All respondents over age 50
More than two out of five (44.2%) of respondents knew where to go to get an HIV test. N = 877
Tobacco products were currently used by 19.3% of respondents on at least some days. N = 844 jagopunjabjagoindia.com
Of respondents who drank alcohol in the past 30 days, 65.1% had two or more drinks on average on the days they drank and 35.7% had five or more drinks in two hours on one or more days. www.cancercouncil.com.au N = 243 & 249, respectively
Of women with children, 77.2% reported they had initiated breastfeeding, even for a short time. N = 872 (WIC, 2012)
Community Factors • Safety (N = 864) • Safe or Very safe: 62.5% • Empowerment (N = 846) • Empowered or Very empowered: 34.1% • Top sources of health information • Television: 12.9% • Healthcare provider: 12.3% • Family: 12.0% • Friends: 12.0%
Discussion • Areas of greatest need • Healthcare costs too much for a lot of people • WIC and SNAP utilization could possibly be improved • There is a need for culturally-competent and language-specific healthcare and health resources • Cancer screening rates are very low • Heavy and binge drinking is a problem that needs to be addressed in the community
Survey Limitations • Sampling method • Venues • Word-of-mouth • Over-representation • Survey length • Paper versus electronic • Possible solutions • Dedicated training for survey administrators • Expand recruitment venues • More rigorous data collection and sampling
Recommendations Public Policy Society (cultural values, norms) Community (schools, neighborhoods) Interpersonal (peers, partners, family) Individual (behaviors, knowledge, attitudes)
Thank You! Questions or Comments?
Contact Information Sherry Liao CHW Program Evaluation Intern Chronic disease prevention and health promotion Division of public and behavioral health sliao@health.nv.gov (775) 684-4122 Melanie Flores Community health worker Program manager Chronic disease prevention and health promotion Division of public and behavioral health mflores@health.nv.gov (775) 687-7509 Eliane Fuentes Community health worker Program Coordinator Chronic disease prevention and health promotion Division of public and behavioral health eefuentes@health.nv.gov (775) 684-4083
References • Taveras, E. M., Gillman, M. W., Kleinman, K. P., Rich-Edwards, J. W., & Rifas-Shiman, S. L. (2013). Reducing racial/ethnic disparities in childhood obesity: the role of early life risk factors. JAMA pediatrics, 167(8), 731–8. doi:10.1001/jamapediatrics.2013.85 • Sánchez, V., Cacari Stone, L., Moffett, M. L., Nguyen, P., Muhammad, M., Bruna-Lewis, S., & Urias-Chauvin, R. (2014). Process Evaluation of a Promotora de Salud Intervention for Improving Hypertension Outcomes for Latinos Living in a Rural U.S.-Mexico Border Region. Health promotion practice. doi:10.1177/1524839913516343 • Spanakis, E. K., & Golden, S. H. (2013). Race/ethnic difference in diabetes and diabetic complications. Current diabetes reports, 13(6), 814–23. doi:10.1007/s11892-013-0421-9 • Grossman, C. I., Purcell, D. W., Rotheram-Borus, M. J., & Veniegas, R. (n.d.). Opportunities for HIV combination prevention to reduce racial and ethnic health disparities. The American psychologist, 68(4), 237–46. doi:10.1037/a0032711 • Molina, Y., Thompson, B., Espinoza, N., & Ceballos, R. (2013). Breast cancer interventions serving US-based Latinas: current approaches and directions. Women’s health (London, England), 9(4), 335–48; quiz 349–50. doi:10.2217/whe.13.30
References • Liss, D. T. & Baker, D. W. (2014). Understanding Current Racial/Ethnic Disparities in Colorectal Cancer Screening in the United States: The Contribution of Socioeconomic Status and Access to Care. American Journal of Preventive Medicine, 46(3), 228-236. http://dx.doi.org/10.1016/j.amepre.2013.10.023 • Molina, Y., Thompson, B., Espinoza, N., & Ceballos, R. (2013). Breast cancer interventions serving US-based Latinas: current approaches and directions. Women’s health (London, England), 9(4), 335–48; quiz 349–50. doi:10.2217/whe.13.30 • Livingston, G., Minushkin, S., & Cohn, D. (2009). Hispanics and health care in the United States: access, information, knowledge. Pew Hispanic Center, Robert Wood Johnson Foundation. http://pewhispanic.org/files/reports/91.pdf • Juckett, G. (2013). Caring for Latino patients. American family physician, 87(1), 48–54. Retrieved from http://www.ncbi.nlm.nih.gov/pubmed/24326471 • Pew Hispanic Center. (2013). Statistical Portrait of Hispanics in the United States, 2011. http://www.pewhispanic.org/2013/02/15/statistical-portrait-of-hispanics-in-the-united-states-2011/#2