Download
1 / 22
220 likes | 385 Views
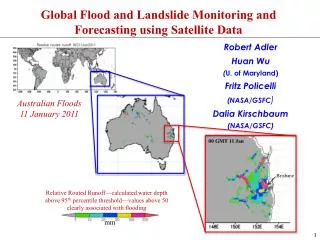
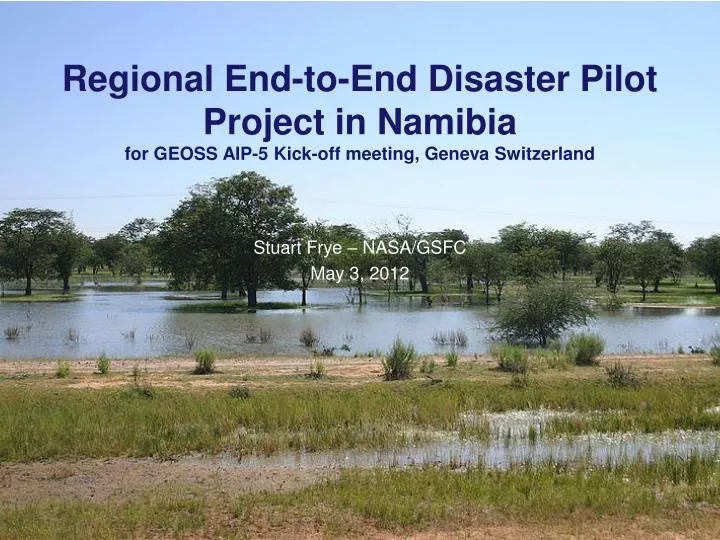
Regional End-to-End Disaster Pilot Project in Namibia for GEOSS AIP-5 Kick-off meeting, Geneva Switzerland. Stuart Frye – NASA/GSFC May 3 , 2012. Where is Namibia. Stakeholders. Namibia Department of Hydrology University of Namibia Department of Geography

E N D
Regional End-to-End Disaster Pilot Project in Namibiafor GEOSS AIP-5 Kick-off meeting, Geneva Switzerland Stuart Frye – NASA/GSFC May 3, 2012
Stakeholders • Namibia Department of Hydrology • University of Namibia • Department of Geography • Multidisciplinary Research Center • Namibia Ministry of Health • NASA/GSFC • University of Maryland, Department of Geography • University of Oklahoma • University of Chicago • Open Cloud Consortium • Committee on Earth Observing Satellites (CEOS) • Disaster Societal Benefit Area • Working Group on Information Systems and Services (WGISS)
Project Objectives • Define & facilitate implementation of a sensor web-based architecture for risk management from a multi-hazard perspective • Address scope of GEOSS Task (Disaster Management DI-01-C5) • Expected Impact: • Reduce the time to acquire and improve the use of relevant satellite data for flood assessment and forecasting • Increase the usefulness of derived satellite flood data products for local populations • Approach: • Coordinate with WGISS to document and prototype a disaster management architecture to demonstrate improved decision support capability and access to remote sensing assets • Conduct socioeconomic surveys in flood prone areas • Identify local concerns/cultural barriers which prevent use of local flood forecasts • Explore methods to incorporate local observations into decision support systems and social networking technology (e.g., crowd sourcing)
NASA Flood SensorWeb Concept Trigger automatic high resolution satellite data acquisition Task Multiple Sensors in Area of Interest Detect Heavy Rains and Floods Upstream at a coarse level (River Gauge) Acquire Satellite Data (Images) Analyze Risks Automatically Acquire Insitu Data Analyze Images (1) Automatically update model and validate (2) Display data on Web
SensorWeb High Level Architecture Sensors, Algorithms and Models Wrapped in Web Services Provide Easy Access to Sensor Data and Sensor Data Products Internet floods, fires, volcanoes etc Data Processing Web Services Node SWE Node Level 2 algorithms (e.g. flood extent) Geolocation, Orthorec, Coregistration, atmospheric correction Level 0 and Level 1 processing SWE Node SWE Node EO-1 Satellite SAS SAS Get satellite images In-situ Sensor Data Node UAV Sensor Data Node RSS Feeds Web Notification Service (WNS) SOS SOS Sensor Data Products Sensor Planning Service (SPS) L1G WFS WFS Sensor Observation Service (SOS) SPS SPS OpenID 2.0 Satellite Data Node GeoBPMS Web Coverage Processing Service (WCPS) Design new algorithms and load into cloud Workflows Task satellites to provide images
Cloud Configuration for Flood Dashboard CREST Hydrological Model Namibian River Gauge Stations - Daily Measurements TRMM based Global Rainfall Estimates Radarsat Images & flood extent maps Storage – 1 year Hyperion & ALI Level 1R MODIS Daily Flood Extent Map Namibia River Gauge Data base Storage – 1 year Hyperion & ALI Level 1G Global Disaster and Alert and Coordination System (GDACS) Storage – 1 years Hyperion & ALI Level 1R and Level 1G AC Flood Dashboard Display Service - Mashup - Google Maps Inset - Plot Package Storage – 1 year User Defined L2 Products e.g. EO-1 Flood Mask • Eucalyptus/Open Stack-based Elastic Cloud SW • 300+ core processors • 40 x 2 Tbytes of storage • 10 Gbps connection to GSFC • - being upgraded to 80 Gbps (Part of OCC) • Hadoop/Tiling • Supplied by Open Cloud Consortium • Open Science Data Cloud Virtual Machines & HTTP server to VM’s http server
Hadoop and Tiling Handles Large Dataset Displays Storage – 1 year Hyperion & ALI Level 1R Storage – 1 year Hyperion & ALI Level 1G HBase storage of multiple missions over multiple days Hadoop / HBase Partition into Cloud Cache Suitable for Google Earth / Open Layers Storage – 1 years Hyperion & ALI Level 1R and Level 1G AC Storage – 1 year User Defined L2 Products e.g. EO-1 Flood Mask Web map Service (WMS)
Google Earth View of High Population and High Flood Risk Area in Northern Namibia Angola Namibia Shanalumono River Gauge Station Water flow from North through basin
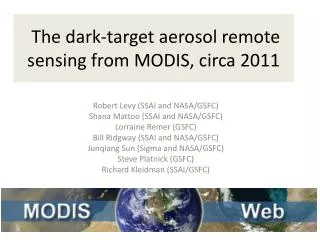
EO-1 Satellite Image of High Risk Flood Area in Northern Namibia Shanalumono river gauge station taken from helicopter Earth Observing 1 (EO-1)Advanced Land Image (ALI) Pan sharpened to 10 meter resolution, Oshakatiarea
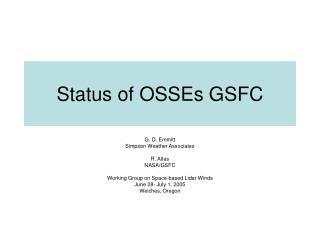
Global Disaster and Coordination System- (Based on AMSR-E) Early user alert TRMM based rain estimates. Monitor rains in Northern basins that drain into Namibia. Shanalumono River Gauge Station Daily flood gauge levels & predicted river levels plots GeoBPMS (Tasks satellites in an area of interest) MODIS Daily Flood Mask Follow flood wave down basin Auto-trigger Hi-res Satellite images CREST Model and pre-warning probability Select river gauges, coarse daily flood extent maps or models/pre-warning probability to auto trigger high resolution satellite data acquisition Flood Dashboard (mashup) High resolution satellite imagery (e.g. EO-1) High Level Diagram of Namibia Flood SensorWeb for Early Warning
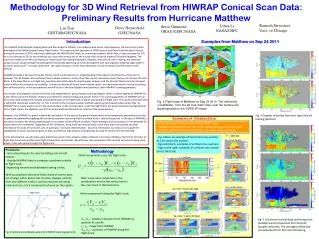
Training for Data Capture Georeferenced photos to enable Rob Sohlberg from Univ. of Maryland to train classifier to detect presence of water in grassy marsh lands via from satellite data. McCloud Katjizeu (orange) Dept of Hydrology compares GPS readings of control point with UNAM students for mapping exercise
Flood Impact on Wild Life and Subsequently on Humans Nearby Hippo tracks near villager Crop fields. Hippo crop destruction is big impact to villagers.
Request from Namibia Hydrological Services • Monitor flooding in near-real time • Create classification products • partition floodwaters by turbidity • presence of grasses, etc. • Demonstrate rapid prototyping utilizing Web Coverage Process Services (WCPS) • To be used to both inform civil managers and – more importantly – to developed and validate predictive models. • Improved hydrological model based on CREST • Model developed by University of Oklahoma • Improved data products pipeline ( more automation)
Contributions of Namibian Partners • Local terrain expertise to improve modeling • Knowledge of local populations • Expertise on conducting local surveys • Develop new techniques and products useful to decision makers • Namibian model will be extended to other countries and applications. Dan Mandl/NASA, AlphonsMosimane/UNAM, Selma Lendevlo//UNAM, Dr. Julie Silva/UMD, Dan Mandl/NASA, Victoria Shifidi/Dept Hydrology , Dr. Simon Angombe/UNAM, Margaret Angula/UNAM Socioeconomic team discusses desired outcomes, timeline and next steps to develop a village level study which is integrated with Hydrology Dept. effort. Hydrology team begins river validation exercise
Planned Technical Enhancements to Flood DashboardCurrent Flood Dashboard on Computation Cloud
Planned Technical Enhancements to Flood Dashboard • Partnership with Canadian Space Agency to simultaneously task EO-1 and Radarsat and deliver products from both automatically to Flood Dashbaoad • Color code river stations to indicate underlying states and click for details • More options on hydrographs • Min • Max • Average • Rainfall plots overlay • Daily excel file download from FTP site and which provides underlying status and color codes of river gauges • Track visitors to site • Prototype pre-early flood warning which shows probability of flooding for next two weeks (via a plot) and is updated daily by model (see next slide) • Developed by University of Oklahoma (Yang Hong and Zac Flamig)
Planned Technical Enhancements to Flood Dashboard • Obtained data from Central Bureau of statistics on this trip. Put on dashboard • New dwelling unit data base with schools, roads, commercial buildings, hospitals etc. geolocated and identified by class • Begin to evaluate how to use flood data with this data base (e.g. roads blocked due to floods) • Collected hundreds of GPS encoded photos to enhance /calibrate flood classification algorithm for EO-1 • Met with Ministry of Health, National Vector Borne Disease Control Program, personnel to discuss adding water-borne disease risk maps as layer on Flood Dashboard • Dr. Petrina Uusikia, Chief Medical Officer, National Vector-borne Disease Control Program, Ministry of Health • Closhilde Narib, • Met with Dr. Martin Hipondoka, head of Remote Sensing at Univ. of Namibia • Trying to arrange training on classification for floods using EO-1 optical imagery and Radarsat imagery
Contact Information and Background • stuart.frye@nasa.gov • The following two pages contain a short list of the servers we have setup that are based on Open Geospatial Consortium standard interfaces. • We have not implemented all the OGC standards, but you can find examples of the rest by checking the OGC website http://www.opengeospatial.org • The idea is that services and components are on the internet, so you can access them with http:// or https:// • Servers should have an XML description document that tells clients how to access things that server has • The servers should have an Application Programmer Interface so clients can automatically access them via scripted actions, not just manual browser actions • The servers should have enough security to ensure that the users are who they say they are so actions taken by the clients can receive delegated authority to do the same things that the user who launched the client are allowed to do • Each of these have a long list of needed improvements, but the rudimentary ideas are demonstrated OK
URL’s and Descriptions • OpenID Provider-Server = https://op.geobliki.com/ controls the security (this is where you setup your account) • Campaign Manager = http://geobpms.geobliki.com/home allows tasking requests to be submitted (i.e., targets) • EO-1 Server = http://eo1.geobliki.com/ this is where EO-1 data can be found along with the status of future and past taskings • Radarsat Server = http://radarsat.geobliki.com/radarsat where we provide access to Radar raw data, browse images, metadata, and processed flood produicts • MODIS Flood Server (API) = http://modis.geobliki.com/modis is where you can point your browser to manually check on daily MODIS flood maps • MODIS Flood Server (GUI) = http://oas.gsfc.nasa.gov/floodmap/ is the server that provides and API for accessing the daily MODIS maps
URL’s Concluded • Flood Dashboard Client = http://matsu.opencloudconsortium.org/namibiaflood this is an example of a client implementation that runs on a cloud computing platform provided through a collaboration with the University of Illinois/Chicago • WCPS Server = http://matsu.opencloudconsortium.org/wcps/session/login is where you go to generate and run algorithms against satellite data • Pub/Sub Server = http://opsb.geobliki.com/session/new is where you setup a subscription for requesting notifications about new data in your area or from a particular instrument or with a particular feature or….The notifications come via Email, SMS, or twitter and contain RSS or Atom feeds for you to follow to find the processed or raw data. Clients can be automated to monitor the feeds and pull the data they are programmed to look for