1 / 34

Figure 18-1 Fiber-optic communication system.

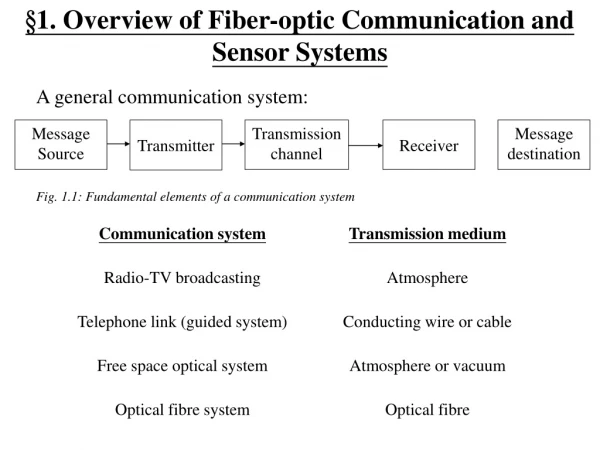
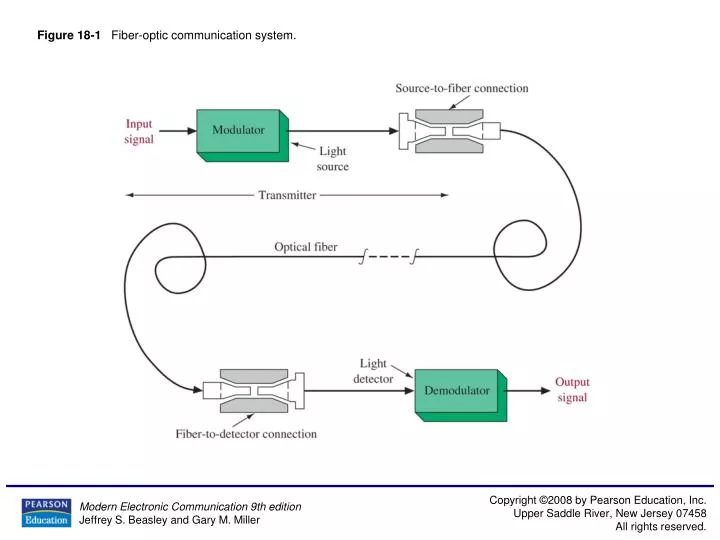
Figure 18-1 Fiber-optic communication system. Figure 18-2 Refraction of light. Figure 18-3 Critical angle. Figure 18-4 The electromagnetic wavelength spectrum. Figure 18-5 Single-fiber construction. Figure 18-6 (a) Development of numerical aperture; (b) acceptance cone.

zahir-ellis
Download Presentation

Figure 18-1 Fiber-optic communication system.

An Image/Link below is provided (as is) to download presentation Download Policy: Content on the Website is provided to you AS IS for your information and personal use and may not be sold / licensed / shared on other websites without getting consent from its author. Content is provided to you AS IS for your information and personal use only. Download presentation by click this link. While downloading, if for some reason you are not able to download a presentation, the publisher may have deleted the file from their server. During download, if you can't get a presentation, the file might be deleted by the publisher.

E N D

Presentation Transcript


  1. Figure 18-1 Fiber-optic communication system.

  2. Figure 18-2 Refraction of light.

  3. Figure 18-3 Critical angle.

  4. Figure 18-4 The electromagnetic wavelength spectrum.

  5. Figure 18-5 Single-fiber construction.

  6. Figure 18-6 (a) Development of numerical aperture; (b) acceptance cone.

  7. Figure 18-7 Modes of propagation for step-index fiber.

  8. Figure 18-8 Modes of propagation for graded-index fiber.

  9. Figure 18-9 Types of optical fiber.

  10. Figure 18-10 Typical attenuation of cabled fiber strand.

  11. Figure 18-11 Pulse broadening or dispersion in optical fibers.

  12. Figure 18-12 Spectral component propagation: single-mode, step index.

  13. Figure 18-13 Polarization mode dispersion in single-mode fiber.

  14. Figure 18-14 Semiconductor laser.

  15. Figure 18-15 Light output versus bias current for a laser diode.

  16. Figure 18-16 LED modulator.

  17. Figure 18-17 Spectral response of a p-i-n diode.

  18. Figure 18-18p-i-n diode.

  19. Figure 18-19 Avalanche photodiode.

  20. Figure 18-20 Sources of connection loss.

  21. Figure 18-20 (continued) Sources of connection loss.

  22. Figure 18-21 Fiber connectors.

  23. Figure 18-22 System design.

  24. Figure 18-23 A graphical view of the system design problem shown in Figure 18-22.

  25. Figure 18-24 An alternative view of the system design problem.

  26. Figure 18-25 An OTDR trace of an 850-nm fiber.

  27. Figure 18-25 (continued) An OTDR trace of an 850-nm fiber.

  28. Figure 18-26 An example of connecting a PC to an Ethernet hub or switch via fiber.

  29. Figure 18-27 Examples of point-to-point connections using fiber in local area networks.

  30. Figure 18-28 A fiber link showing emitter, detector, connectors, and fiber cable.

  31. Figure 18-29 Light probe.

  32. Figure 18-30 The Multisim circuit for the light-budget simulation.

  33. Figure 18-31 The settings for the voltage-controlled sine-wave generator that is being used to model an optical receiver with a minimum and maximum RSL.

  34. Figure 18-32 Figure for Problem 49.

More Related