Download
1 / 21
210 likes | 432 Views
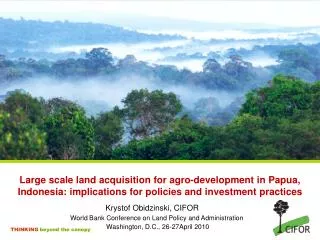
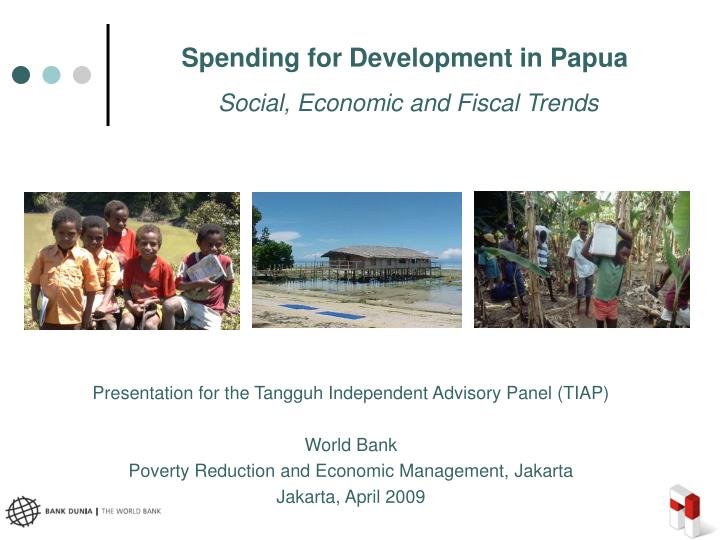
Spending for Development in Papua . Social, Economic and Fiscal Trends. Presentation for the Tangguh Independent Advisory Panel (TIAP) World Bank Poverty Reduction and Economic Management, Jakarta Jakarta, April 2009. Spending for Development in Papua: Key Messages. Main message

E N D
Spending for Development in Papua Social, Economic and Fiscal Trends Presentation for the Tangguh Independent Advisory Panel (TIAP) World Bank Poverty Reduction and Economic Management, Jakarta Jakarta, April 2009
Spending for Development in Papua: Key Messages Main message Papua’s key challenge is not to generate additional resources but to use the existing resources wisely. Poverty and the economy Papua and West Papua (or Papua Barat) are provinces of extremes, with high poverty, relatively high GDP, the lowest population density and the highest fiscal resources in Indonesia. Since 2002, poverty declined from 46 percent to 37 percent. However, Papua and West Papua remain Indonesia’s poorest regions. The district of Teluk Bintuni, where the new Tangguh plan is located, is lagging in most social and economic indicators, with the exception of regional GDP and child immunization. Revenues, expenditures and fiscal projections Since 2000, Papua’s revenues have increased fivefold (in real terms). Since 2002, when special autonomy started, revenues have increased 2.5 times (in real terms). Spending on government administration has traditionally dominated Papua’s expenditures. However, since 2006, infrastructure spending has increased substantially and overtaken government administration. After modest increases in the next 5 years, Papua’s overall revenues are expected to double by 2020 but only partly due to revenues from Tangguh LNG. However, the province of Papua Barat will substantially increase its revenues due to Tangguh. 1
A note on the use of the term “Papua” • Papua refers to both Papua province and Papua Barat province. • Papua province refers to the Province of Papua after splitting with Papua Barat. • Papua Barat refers to the Province of Papua Barat (West Papua), which was established in 2004. 2
Since 2002, poverty declined from 46 percent to 37 percent but Papua remains Indonesia’s poorest region Source: Central Bureau Statistic (BPS) Source: Central Bureau of Statistics (BPS), various publications. 3
Papua’s regional GDP is high; Papua province is even 50% higher than the national average, mainly due to mining Source: Central Bureau of Statistics (BPS) 4
However, excluding mining, both provinces are below the national average, and Papua Barat is richer than Papua Source: Central Bureau of Statistics (BPS) 5
Mining dominates the economy of Papua province … Note: * Government administration mainly consists of salaries. Public investment, including for administration (e.g. cars offices) is part of the other economic categories. Excluding mining, the share of core government administration would raise to above 15% of GDP, one of the highest in Indonesia. ** Includes sectors such as manufacturing, financial services, electricity, gas, and water supply. Source: Central Bureau of Statistics (BPS) 6
…while Papua Barat’s economy is much more diversified Note: * Government administration mainly consists of salaries. Public investment, including for administration (e.g. cars offices) is part of the other economic categories.Excluding mining, oil, gas and related manufacturing the share of core government administration would raise to 11% of GDP, also one of the highest in Indonesia. ** Includes sectors such asfinancial services, and electricity, gas, and water supply. Source: Central Bureau of Statistics (BPS) 7
The district of Teluk Bintuni is lagging in most social and economic indicators, with the exception of regional GDP and child immunization. Source: Central Bureau of Statistics (BPS) and Ministry of Health Source: Susenas, BPS and Ministry of Health statistics. 8
Revenues, Expenditures and Fiscal Projections
In 2002, Papua’s revenue per capita was the second highest in Indonesia … Note: Consolidated data (province + districts) per capita. Source: Regional Information Financial System (SIKD) Ministry of Finance and BPS. 9
…and by 2009, Papua and the new Papua Barat province have become Indonesia’s fiscally richest provinces… Note: Consolidated data (province + districts) per capita. Source: Regional Information Financial System (SIKD) Ministry of Finance and BPS. 10
… which is partly due to additional transfers through the special autonomy fund, which only Papua, Papua Barat and Aceh are receiving [1] The revenues will be allocated to the provincial government, producing districts, and other districts within the province. [2] DAU: General allocation funds [3] Starting from 2009, the Papua and West Papua provinces got 70% and 30%, respectively, of the Otsus funds for the whole Papua Island. [4] West Papua was established in late 2003. However, until 2008, the Otsus funds for all districts in the province were managed by the Papua provincial government, and the West Papua provincial government did not get any Otsus funds. 11
Transfers to Papua increased significantly in 2006. Since then, they remained stable for Papua province but continue to increase for Papua Barat’s due to higher Special Autonomy allocations Papua Papua Barat Source: SIKD and Balancing Fund Allocation (Ministry of Finance). Note: - Consolidated data (province + districts) for Papua and Papua Barat, in constant 2007=100. In 2006, shared tax data only for income tax. - Since 2009, the central government “shares the burden” of energy and fertilizer subsidies with sub-national governments. Approximately 26% of the estimated subsidies will be deducted from the DAU-pool of sub-national governments. 12
Spending in Papua continues to be dominated by districts which provide approximately 75% of expenditures since 2006 Note : 2004-2006: Realization, 2007: Realization (Central) and Plan (others), 2008: Unaudited Realization (Central) and Estimation (others), 2009: Estimation Source : DG Budget, Regional Finance Information System (SIKD), Min of Finance. Note: Consolidated data (province + districts) for Papua and Papua Barat in constant 2007=100. The central government spending does not include line ministries spending through their representative offices in the regions. Source: SIKD, Ministry of Finance, provinces budget data. 13
Since 2005, infrastructure spending increased substantially and became Papua’s main expenditure; government administration remains high in second place Note : - Consolidated data (province + districts) for Papua and Papua Barat province in constant 2007=100. - * Plan budget data. Source : SIKD, Ministry of Finance and provinces’ budget data. 14
Assumptions for future revenue projections, particularly consi-dering additional revenues from Tangguh LNG (see next two slides) • General revenue projection: • Central government growth projections: 4.7% (2009), 5.6% (2010), 6.3% (2011), 6.40% (2012), 6.7% (2013), 7.0% (2014), 7.0% (2015), 7.0% (2016), 7.0% (2017), 7.0% (2018) • Revenue/GDP (for US$ 40 per barrel, for other oil prices proportionately higher): 15.9% (2010), 15.7% (2011), • 16.0% (2012), 16.6% (2013), 16.8% (2014), 16.9% (2015), 16.7% (2016), 16.6% (2017), 16.3% (2018) • Ratio of Papua DAU to total national DAU: 5% • Ratio of special autonomy fund to total national DAU: 2%. • Ratio of Papua revenue sharing to total national revenue sharing: 4.4% • Ratio of Papua DAK to total national DAK: 8.4% • Revenue projection from Tangguh LNG: • Annual production: gradually increase from 2.6 in 2010 to 7.6 million ton in 2015. • Investment cost plus interest: USD 9.6 billion. • Ratio of investment credit and cost recovery to gross revenue: 80%. • Ratio of cost recovery to gross revenue: 30%. • Contractor share of equity to be split: 71% (before tax). • Effective tax rate: 44%. • Regional tax: 13.6%. • Revenue sharing to central government: 30%. • Revenue sharing to Papua: 70%. Note: For more details on the relationship between oil prices and the Indonesian budget as well as revenue sharing with the regions see Agustina et al “Black hole or black Gold? The impact of oil and gas prices on Indonesia’s Public Finances, Policy Research Working Paper (4718), World Bank. 15
Based on these assumptions, Papua’s revenues are expected to double by 2018, even though revenues from Tangguh would only add another 8-12% (Rp 3-5 trillion) in extra revenues Note: Consolidated data (province + districts)for Papua and Papua Barat, in constant price 2007=100. Source: MoF and WB staff estimation. 16
However, for Papua Barat the increase will be significant because it would incur all of Tangguh’s shared revenue: By 2018, at US$40 per barrel, revenues would increase by almost 30% compared to the baseline; at US$80 per barrel, revenues would increase by more than 50% Note: Consolidated data (province + districts)for province and districts in Papua Barat, in constant price 2007=100. Source: SIKD/MOF and WB staff estimation. 17
Wolfgang Fengler (wfengler@worldbank.org)Dian Agustina (cagustina@worldbank.org)Adrianus Hendrawan (ahendrawan@worldbank.org) For information please contact the Public Finance and Regional Development team of the World Bank in Indonesia: