Download
1 / 44
450 likes | 573 Views
Managing Outcomes. Lisa Werner, MBA, MS, CCC-SLP Director of Consulting Services. Data Analysis. Why do we do it? Accurate outcome data is a powerful tool that can be used to educate key decision makers in the hospital, potential patients, payers, and the community at large.

E N D
Managing Outcomes Lisa Werner, MBA, MS, CCC-SLP Director of Consulting Services
Data Analysis Why do we do it? • Accurate outcome data is a powerful tool that can be used to educate key decision makers in the hospital, potential patients, payers, and the community at large. • Marketing efforts are enhanced when outcome information is used during direct marketing calls. • The team benefits from use of outcome information by being able to see where they are the most effective and also by being able to focus improvement efforts. • Breaking down your performance may reveal opportunities to capture the burden of care and yield greater reimbursement.
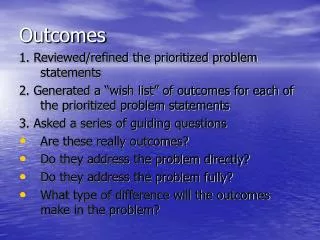
Data Analysis When conducting data analysis, ask yourself: • Does the data look real? • It is important to validate that the data that you are analyzing is reliable. • Can you identify any inaccuracies in your sample? • Do the outcomes meet your expectations? • Compare your outcomes to your goals and industry benchmarks. • How do you stack up? • What impact would change make? • Would there be a positive impact on your patient care services if you improved your performance in this area?
Data Analysis • Selecting Indicators: • Review outcomes • Determine what is below benchmark • Figure out what is meaningful to your facility • Determine what is attainable for your facility
Facility Report • Case Mix Index • Are you getting paid for the work that you do? • Does it seem like your CMI is lower than your burden of care? • Capturing the proper CMI is essential to enable you to staff appropriately. • Since many of us predict staffing ratios based on patient acuity as realized through the CMI, it is important to capture what most closely reflects the care being rendered on the unit.
Facility Report • Case Mix Index: • Benchmark against the nation and the region. • Investigate the components- • Rehabilitation Impairment Classification • Motor Functional Independence Measure Subscale Weighted Score at Admission • Age • Tier Assigning Co-morbid Conditions • Investigate the distribution of impairment groups, CMG, or RIC. • Investigate the components for the most common groups.
Facility Report • Average Medicare Expected Reimbursement: • Based on Medicare reimbursement • Adjusted for your facility pricer as updated through eRehabData • Includes calculations for transfer payments and short stay reductions
Facility Report • Transfer Patients: • Percentage of patients that are discharged to another Medicare bed • Acute care • SNF • LTACH • Another IRF • Discharge Destination: • Breakdown of discharge locations for the patient’s served • Skilled nursing and subacute designation errors
Facility Report • Averages: • Two benchmarks: Weighted and unweighted • Onset days: Different instructions by RIC • Length of stay considerations • Functional Independence Measure scoring data- • Admission Totals • Discharge Totals • Functional Independence Measure Change • Motor subscale at admission
Facility Report • Individual Functional Independence Measure Items: • Admission, discharge, change, and follow-up • Explains difference between facility totals and benchmark totals • First glance at isolating Functional Independence Measure scoring errors
Breaking Down the CMI Tips: • Evaluate your admission Functional Independence Measure scores • How does your admission Functional Independence Measure score compare to those in your region and across the nation?
Breaking Down the CMI • Determine what percentage of the time you are scoring a tiering comorbidity
Breaking Down the CMI • Pay attention to the most commonly used comorbidity lists
Breaking Down the CMI • Pull reports to show your CMG breakdown • Are you missing high acuity patients, low acuity patients?
Breaking Down the CMI • Pay attention to the warnings to tell you when there is a mismatch between IGC and Etiologic diagnosis
Drill-Down • Reimbursement: • Determine which populations have the greatest transfer payment percentages. • Evaluate length of stay by RIC, IGC, CMG. • Review discharge destinations by group. • Use the patient report to identify outliers.
Drill-Down • Averages: • Onset days should be evaluated on a RIC basis to ensure you are hitting your targets given the definition stated in the IRF-PAI Training Manual. • RIC Report • Referral date to admission date • Length of Stay should be evaluated to ensure you are hitting your targets. • RIC, IGC, CMG, Patient Report
Drill-Down • Averages: • Functional Independence Measure Scores • Total Admission Functional Independence Measure shows patient’s overall burden of care and potentially indicates barriers to progress or expected rate of progress. • Total Discharge Functional Independence Measure shows patient’s achieved performance. Scores are gathered across the last 3-days of the stay. Facility identifies patient’s best performing 24-hour period and the lowest scores from that day are reported on the IRF-PAI. • Functional Independence Measure Change is the amount of gain from admission to discharge and is also reported on a per day gain basis. • Considerations: • Totals reviewed for total population • Totals reviewed by RIC, IGC, CMG • Items reviewed in for total population • Items reviewed by RIC, IGC, CMG • Functional Independence Measure Scoring Comparison Graph • Time-Series Graph • Metrics
Strategies • Averages: • Evaluate screening and admission process to determine if patients are being admitted at the right time in their recovery. • Evaluate initial IRF-PAI scores for proper scoring • Be sure that the lowest score is taken from the documentation • Be sure that a full set of scores is captured daily • Set the stage for accuracy through communication among team members • Evaluate the effect of the volume factor. • Start an ADL program, ambulation group, cognitive group, etc to focus on enrichment of skills learned in 1:1 sessions.
Functional Gain Functional Gain: The Functional Independence Measure change between admission and discharge measures the degree of functional improvement demonstrated by patients. • Effectiveness: Ensuring patients obtain sufficient gain to be able to return to their prior level of function. • What are the problems? • Outcomes are too high • Outcomes are too low • Discrepancy between the scoring of items within the same category
Functional Gain Why would outcomes that are too high be a problem? • Admission Functional Independence Measure scores were too low during the assessment period. • Failure to assess areas of the Functional Independence Measure (i.e., bathing, stairs) can lead to gains above the benchmark.
Functional Gain Tip: Focus on Gain Above Benchmark • Look at the number of 0’s on particular Functional Independence Measure items • Remember 0 is not a score and there are only three reasons that justify the use of 0. • 1. The clinician determines it is not safe. • 2. Medical condition or treatment • 3. Patient refusal • Look at reliability of the scoring for items that exceed benchmark. • Look at facilitators within the environment that enable gains to exceed benchmarks to explain the outcomes.
Functional Gain Why don’t we want gains that are too low? • Why gains are less than the benchmark: • Patients are not admitted from acute in a timely manner • Therapy protocols or techniques need to be examined • Lengths of stay are not sufficient • Functional Independence Measure scoring during the admission process may be delayed
Functional Gain Tip: Focus on Gain Below Benchmark • Look at the average length of stay • Look at interdisciplinary treatment processes • Look at patient mix • Look at volume
Functional Gain • Look at admission scores for individual Functional Independence Measure items • Look at point at which Functional Independence Measure scores are collected (early within 3 day look back or on day 3) • Look at LOS on acute
Functional Gains • Look at returns to acute • Look at discharges to settings other than home
Goal Attainment • Goal setting is important! • Patient metrics page reports admit, discharge, goal, and gain. • Review again goal at team and following discharge for success with goal attainment.
Strategies Goal Attainment: • Emphasize goal revision on the plan of care. • Inservice on goal setting to include proper goal setting and progression of treatment through incremental goal achievement. • Begin reviewing long term goals in the weekly team conference. • Determine a method to communicate current status and goals regularly through a functional status board, stand-up meetings, and/or team conference.
Other Views • Time Series Graphs: • Look at performance over time • Multiple indicators can be viewed simultaneously • Data tables are useful tools for report preparation
Other Views • Functional Independence Measure Scoring Comparison Graph: • Graphs admission, discharge, and change scores for the facility and region/nation • Review weighted and unweighted comparisons • Helps identify items that may require special attention in order to accurately represent the burden of care
Other Views • Percentile Ranking Report: • Allows comparison of your facility’s performance with other units • Ranks your performance by report item • States your facility ranking among all units for that time period • Offers benchmarks of what performance level you would need to reach your desired percentile ranking • Case Mix Index Example: • Facility CMI = 1.1180 • National average CMI = 1.2686 • Facility Percentile Rank = 16.48% • Facility desires to be ranked at 60% of database, so their target CMI = 1.2849
Other Views • 60% Rule Report: • Know how you will report your compliance to the FI: admissions or discharge • Know your cost report year and look back periods • Manage conditionally compliance closely
Other Views • 60% Rule Report: • Confirm the final IRF-PAI with the patient’s status on the compliance report • Presumptive or conditional? • In order to appear on this report correctly, you will answer questions on the eRD tab to determine if the patient is 60% compliant or not. • Review the detailed assessment to determine what makes the patient compliant.
Other Views • 60% Rule Compliance Threshold: • Provided that each patient is properly identified on your 60% report, the compliance threshold established for your current reporting period is adequate. • Every patient that meets the criteria for inpatient rehabilitation deserves to receive that level of care. • Therefore, operating at a higher compliance while beds are empty is essentially denying a patient an opportunity to regain independence. • The key is to be sure that you capture the 60% status of each patient correctly.
Other Views • Dashboard: • Great tool for daily census update • Offers a 14-day projection of census decline for current case mix • Provides 30-day analysis of several indicators: CMI, 60% rule compliance, RIC distribution, and payor source breakdown • In order to provide data, your bed configuration and pricer need to be up to date
Referral Tracking • Referrals Outcomes: • Designed to trend referral sources, referring physicians, and conversion rates. • Offers information on reasons for denied admission. • You can filter the information to drill down on physician, referral source, internal vs. external fill, and reason for denied admission.
Other Views • Referrals Outcomes: • Use information to determine referral trends by- • Referral source • Referring physician • Internal versus external fill • Zip code breakdown • Payor source breakdown • Conversion rates • Reasons for denial • Drill down by RIC, CMG, and Patient • Patient reports list patients denied
Conducting a Non-Admission Review • Non-admission review: The review of all patients that have not been admitted to rehab unit. This is done by reviewing the pre-admission forms and reviewing the section that notes the reason for not admitting to the rehab unit to help identify trends and changes that occur over a quarter. • Common Reasons • Too impaired • Too functional • No bed available • Physician did not agree • Patient or family refused • Insurance did not authorize • Not 60% rule compliant
Conducting a Non-Admission Review • What can we do about the “too impaired” category? • Determine if the admission denial was based on objective criteria • Identify if the denial was based on staff’s lack of competency • Clarify with Medical Director his/her comfort level with the staff managing a patient with that diagnosis or at that level of acuity
Conducting a Non-Admission Review • Denial because “Too Functional” • Review the referral date against the actual date of the screen • Would reducing the number of onset days have resulted in a decision to admit? • Determine what the patient’s deficits really were and if they could have benefited from a stay in an IRF.
Optional Items • Patient Satisfaction Instrument: • 3-Step Satisfaction Tools specific to rehab • Service Recovery • Discharge • Follow-Up • Feedback from Stakeholders: • Reported with demographics • Item by item averages of responses for each item • Same drill-down capabilities as facility reports
Optional Items • Patient Satisfaction Instrument: • Graphs responses to questions from each survey type for selected time period • Graphs historical trends for each question asked on the surveys • Time Series Graphs available to drill-down by patient type or demographic profile • Stores and reports narrative comments provided by patients
Putting It All Together • Best Practices in Performance Improvement – • Communicate • Inservice • Peer Auditing • Use Case Studies to facilitate learning • Select a manageable number for performance indicators to work on • Report change and what worked to facilitate change • Don’t fear it!
Questions? Lisa Werner, MBA, MS, CCC-SLP Lwerner@erehabdata.com 202-588-1766