Download
1 / 23
240 likes | 332 Views
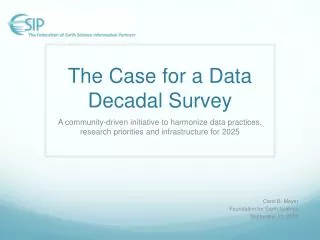
A Metrics Framework for Interannual -to-Decadal Predictions Experiments.

E N D
A Metrics Framework for Interannual-to-Decadal Predictions Experiments L. Goddard, on behalf of the US CLIVAR Decadal Predictability Working Group & Collaborators: Lisa Goddard, Arun Kumar, Amy Solomon, James Carton, Clara Deser, Ichiro Fukumori, Arthur M. Greene, Gabriele Hegerl, Ben Kirtman, YochananKushnir, Matthew Newman, Doug Smith, Dan Vimont, Tom Delworth, Jerry Meehl, and Timothy Stockdale Paula Gonzalez, Simon Mason, Ed Hawkins, Rowan Sutton, Rob Bergman, Tom Fricker, , Chris Ferro, David Stephenson Making sense of the multi-model decadal prediction experiments from CMIP5
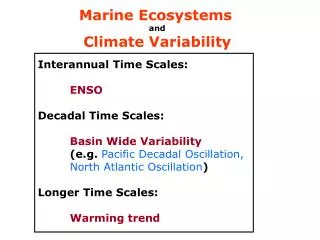
US CLIVAR Decadal Predictability Working Group Formally approved January 2009 Objective 1:To define a framework to distinguish natural variability from anthropogenically forced variability on decadal time scales for the purpose of assessing predictability of decadal-scale climate variations in coupled climate models. Objective 2:Work towards better understanding of decadal variability and predictability through metrics that can be used as a strategy to assess and validate decadal climate prediction simulations. Making sense of the multi-model decadal prediction experiments from CMIP5
Proposed FRAMEWORK for Verification: • 1. Feasibility (of particular model/fcst system) • - Realistic, and relevant, variability?- Translation of ICs to realistic and relevant variability? • 2. Prediction skill – Quality of system; quality of information • - Where? What space & time scales?- Actual anomalies & ‘decadal scale trends’- Conditional skill?- Values of ICs: higher correlations, lower RMSEs • 3. Issues – for research, for concern i.e. limited ability to quantify uncertainty; limited understanding of processes, etc. Making sense of the multi-model decadal prediction experiments from CMIP5
Outline • Objective • Framework • Metrics & examples of results • Statistical significance • Website • Issues relevant to verification endeavor • Bias correction • Spatial scale • Stationarity/reference period Making sense of the multi-model decadal prediction experiments from CMIP5
Motivation: Forecasts need verification … for tracking improvements in prediction systems Example from SI: Recent improvements to ECMWFseasonal forecast system came in almost equal parts from improvementsto the model and the ODA (Balmaseda et al. 2009, OceanObs’09) Example from SI: NCEP-CFS reachesparity with statistical fcstsfor ENSO … for comparison against other systems and other approaches (Saha et al. 2004, J.Clim) Making sense of the multi-model decadal prediction experiments from CMIP5
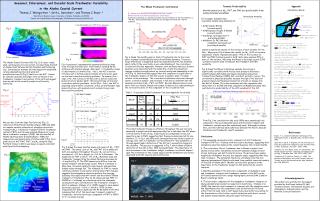
How “good” are they?: Deterministic Metrics Regional Average (15°x15°); 5-Year Means: (Courtesy: Doug Smith) Grid Scale; 10-Year Means: • ECHAM5 + MPI-OM • 3 member perturbed IC ensemble • Starting every 5 years Nov from 1955 to 2005 (Keenlyside et al. 2008, Nature) Making sense of the multi-model decadal prediction experiments from CMIP5
Outline • Objective • Framework • Metrics & examples of results • Statistical significance • Website • Issues relevant to verification endeavor • Bias correction • Spatial scale • Stationarity/reference period Making sense of the multi-model decadal prediction experiments from CMIP5
Asking Questions of the Initialized Hindcasts Question 1: Do the initial conditions in the hindcasts lead to more accurate predictions of the climate? Question 2: Is the model's ensemble spread an appropriate representation of forecast uncertainty on average? Question 3: In the case that the forecast ensemble does offer information on overall forecast uncertainty, does the forecast-to-forecast variability of the ensemble spread carry meaningful information? Time scale: Year 1, Years 2-5, Years 2-9 Spatial scale: Grid scale, spatially-smoothed Making sense of the multi-model decadal prediction experiments from CMIP5
Asking Questions of the Initialized Hindcasts Question 1: Do the initial conditions in the hindcasts lead to more accurate predictions of the climate? • Mean Squared Skill Score and its decomposition (from Murphy, Mon Wea Rev, 1988) Making sense of the multi-model decadal prediction experiments from CMIP5
Deterministic Metrics: Mean Squared Skill Score (MSSS) MSSS MSSS : MSE : MSE : MSE : MSE Making sense of the multi-model decadal prediction experiments from CMIP5
Deterministic Metrics: Mean Squared Skill Score (MSSS) MSSS MSSS : MSE : MSE : MSE : MSE Making sense of the multi-model decadal prediction experiments from CMIP5
Deterministic Metrics: Anomaly Correlation Making sense of the multi-model decadal prediction experiments from CMIP5
Deterministic Metrics: Conditional Bias Making sense of the multi-model decadal prediction experiments from CMIP5
Asking Questions of the Initialized Hindcasts Question 2: Is the model's ensemble spread an appropriate representation of forecast uncertainty on average? Question 3: In the case that the forecast ensemble does offer information on overall forecast uncertainty, does the forecast-to-forecast variability of the ensemble spread carry meaningful information? • Continuous Ranked Probability Skill Score (CRPSS) CRPSS = 1 – (CRPSfcst/CRPSref) Q2: fcst uncertainty = avg ensemble spreadref uncertainty = standard error of ensemble mean Q3: fcst uncertainty = time varying ensemble spreadref uncertainty = avg ensemble spread Making sense of the multi-model decadal prediction experiments from CMIP5
Probabilistic Metrics: CRPSS (Case 1: Ens Spread vs. Std Err) Making sense of the multi-model decadal prediction experiments from CMIP5
Statistical Significance: Non-parametric bootstrap Re-sampling, with replacement: k=1,M (~1000) samples Start out with nominally n=10 start times. Draw random start times as pairs up to n values.i.e. 1st draw: i=1 e.g. I(i,k)=5 (1980), so i=2 I(i+1,k)=6, etc. up to i=10For each I(i,k), draw N random ensemble members, E, with replacement If p-value <= α, then rfx is significant at (1-α)x100% confidence Fraction < 0 = p-value M samples Rfx 0 Making sense of the multi-model decadal prediction experiments from CMIP5
Proto-type Website: Work in progress http://clivar-dpwg.iri.columbia.edu Making sense of the multi-model decadal prediction experiments from CMIP5
Outline • Objective • Framework • Metrics & examples of results • Statistical significance • Website • Issues relevant to verification endeavor • Bias correction • Spatial scale • Stationarity/reference period Making sense of the multi-model decadal prediction experiments from CMIP5
Issues relevant to verification • Spatial scale for verification • Bias (mean and conditional) • Mean bias MUST be removed prior to use or verification of forecasts (WCRP, 2011) • Forecast uncertainty • Conditional bias MUST be removed prior to assigning forecast intervals • Stationarity / reference period Making sense of the multi-model decadal prediction experiments from CMIP5
Spatial Scale: Signal-to-noise GPCP Precipitation Anomalies Based on de-correlation scales, and S2Nconsiderations, advocating Temperature smoothing: 15 longitude x 10 latitude Precipitation smoothing: 10 longitude x 5 latitude (Goddard, Gonzalez, & Jensen, in prep) Making sense of the multi-model decadal prediction experiments from CMIP5
Effect of Conditional Bias on Reliability • Conditional rank histograms - 9-member ensemble fcsts • Normally distributed variable • Ensemble-mean variance = Observed variance • Ensemble spread = MSE • Grey bars are positive anomaliesBlack bars are negative anomalies (Mason, Goddard, and Gonzalez, in prep.) Making sense of the multi-model decadal prediction experiments from CMIP5
Issues: Non-stationarity Effect of out-of-sample reference period (pre-2000) vs in-sample (post-2000) MSE of Global Mean Temperatures for 2001-2010)| Reference Period = 1950 - endpoint MSE (Initialized hindcasts) MSE (Initialized hindcasts) (Fricker, Ferro, Stephenson, in prep.) Making sense of the multi-model decadal prediction experiments from CMIP5
Summary US CLIVAR Working Group on Decadal Predictability has developed a framework for verification of decadal hindcasts that allows for common observational data, metrics, temporal structure, spatial scale, and presentation The framework is oriented towards addressing specific questions of the hindcast quality and suggestions for how they might be used. Considerable complementary research has aided this effort in areas of bias and forecast uncertainty, spatial scale of the information, and stationarity impacts on reference period. Paper to be submitted to Climate Dynamics. Making sense of the multi-model decadal prediction experiments from CMIP5