Download
1 / 22
220 likes | 290 Views
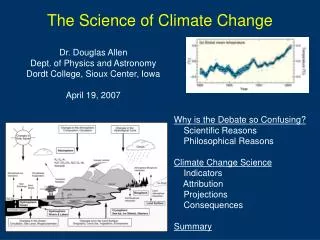
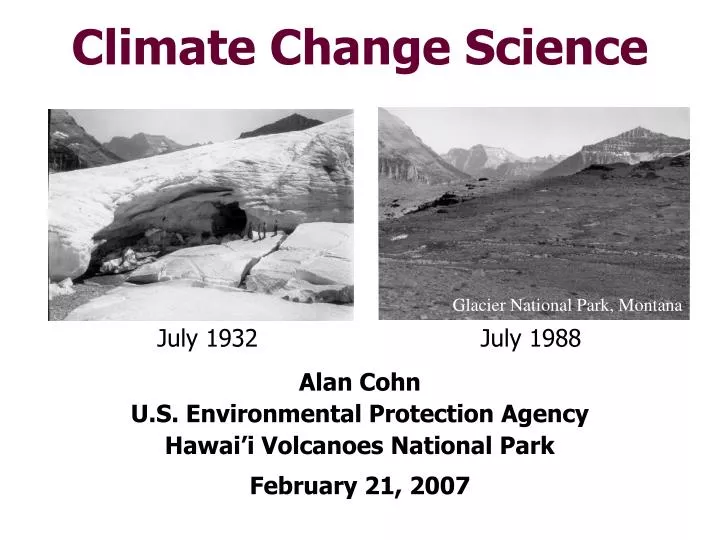
Climate Change Science. Alan Cohn U.S. Environmental Protection Agency Hawai’i Volcanoes National Park February 21, 2007. Glacier National Park, Montana. July 1932. July 1988. Is there a greenhouse effect?. Yes. Greenhouse gases effectively ‘trap’ heat.

E N D
Climate Change Science Alan Cohn U.S. Environmental Protection Agency Hawai’i Volcanoes National Park February 21, 2007 Glacier National Park, Montana July 1932 July 1988
Is there a greenhouse effect? • Yes. Greenhouse gases effectively ‘trap’ heat. • Keeps average surface temperature warmer by ~ 60ºF
A little bit of local history… • In the early 1960s, Charles Keeling began the first continuous recording of CO2 levels in the atmosphere atop Mauna Loa http://www.aip.org/history/climate
Have greenhouse gases increased as a consequence of human activities? • Greenhouse gases such as CO2, CH4, and N2O have increased considerably since 1750. • Present CO2 and CH4 concentration levels highest in the last 650,000 years.
Who’s responsible for these emissions? • Electricity, transportation, and industry biggest emitters • When considering electricity distribution, homes and business account for a lot more
Global CO2 Emissions Data courtesy of Carbon Dioxide Information Analysis Center, DOE
Human Influence on the Atmosphere in the Industrial Era CO2 up 35% CH4 up 151% N2O up 18% Different symbols denote ice core data for several sites in Antarctica and Greenland Source: IPCC WG I (Science) Summary for Policy-Makers, Third Assessment Report, 2001.
Historic CO2 Concentrations Today * Source:IPCC WGI Third Assessment Report, 2001.
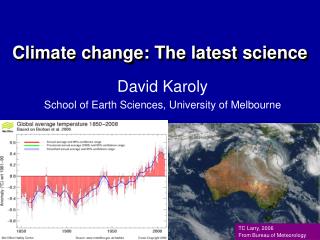
Is the Earth warming? (Relative to 1961-1990 Mean) • Earth’s surface has warmed by about 1.4 º F since 1860 • Most of this warming occurred post 1950 • Most of the warming of the last 50 years is very likely the result of human activities Source: Climate Research Unit, Univ. of East Anglia & UK Met. Office Hadley Centre, 2005.
How much is the Earth warming? • Eleven of the twelve years in the period 1995-2006 rank among the 12 warmest since 1850. • 2006 annual average temperature was warmest on record in U.S. • Warming since the middle 1970s is now about 1°F. • Most areas have warmed • Greatest warming: Over land, northern high latitudes, nights, winter • Observed increase in warm extremes, decrease in cold extreme Source: NASA, 2006.
It is likely warmer now than it has been in at least 2000 years. Source: Compilation of 10 peer reviewed reconstructions, Wikipedia, 2006.
Are greenhouse gases causing the Earth to warm? "Most of the observed increase in globally averaged temperatures since the mid-20th century is very likely due to the observed increase in anthropogenic greenhouse gas concentrations.“ – IPCC, 2007
Additional Evidence of Warming Climate • Earlier spring melting of ice on rivers and lakes • Winter snow cover in the Northern Hemisphere is decreasing • Increased ocean heat content is causing sea level to rise around the world
Arctic sea ice is thinning and decreasing in extent. Sea Ice Minimum 1979 Sea Ice Minimum 2005 • Arctic is warming twice as fast as rest of the world. • Arctic warming has worldwide implications. • Indigenous people, animals and vegetation are affected. • May open new shipping routes. Source: NASA, 2005
Tropical and temperate mountain glaciers are melting • In Montana’s Glacier National Park, 27 glaciers remain of 150 in 1850. • Researchers have documented rapid mountain glacier retreat in Greenland, the European Alps, the Himalayas, Ecuador, Peru, Venezuela, New Guinea, and East Africa, among other places. Qori Kalis Glacier, Quelccaya Ice Cap, Peru, are shown between 1978 (top) and 2002. The glacier retreat during this time was 1,100 meters.
What about the future? • Greenhouse gases and temperatures will very likely continue to increase. • There are important uncertainties about future emissions and how the climate will respond to them.
Sea Level will continue to rise. • 1 to 3 foot rise possible by end of century. • Will continue to rise even if temperatures stop rising. • May rise more if warming accelerates melting of glaciers. Source: UK Met Office,Hadley Centre, 2002. http://www.met-office.gov.uk/research/hadleycentre/pubs/talks/sld036.html
Extreme Event Projections • Higher maximum temperatures and more hot days and heat waves over land areas. • Higher minimum temperatures and fewer cold days, frost days and cold waves. Source: IPCC SPM, Third Assessment Report, Climate Change 2001: The Scientific Basis, 2001.
Extreme Event Projections • More intense precipitation events over many areas. • Increase summer continental drying and associated risk of drought. • Increase in tropical cyclone peak wind and precipitation over some areas. Source: IPCC SPM, Third Assessment Report, Climate Change 2001: The Scientific Basis, 2001.
For More Information www.epa.gov/climatechange