Download
1 / 48
480 likes | 601 Views
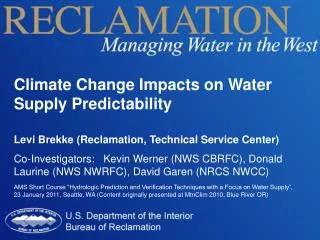
Climate Change and Potential Impacts to Water Operations. Levi Brekke (Reclamation, Technical Service Center). Presentation for the Bighorn River System Issues Group 29 July 2008, Lovell, WY. Outline . Is climate changing? Are we affecting it? Can we predict it?

E N D
Climate Change and Potential Impacts to Water Operations Levi Brekke (Reclamation, Technical Service Center) Presentation for the Bighorn River System Issues Group 29 July 2008, Lovell, WY
Outline • Is climate changing? • Are we affecting it? • Can we predict it? • Recent climate projections? • Impacts to hydrology and operations? • Factoring it into longer-term planning?
“Warming of the climate system is unequivocal, as is now evident from observations of increases in global average air and ocean temperatures, widespread melting of snow and ice, and rising global mean sea level.” IPCC (2007) Working Group 1 Summary for Policymakers
Other Global Trends Global Mean Air Temperature Global average sea level Northern Hemisphere snow cover Fig. IPCC (2007)
Western U.S. Climate Temperature 1950-1997 trend (Mote et al. 2005) Precipitation 1976-2005 trend, “annual” inches/decade (www.cpc.noaa.gov/anltrend.gif)
Bighorn Basin region:NOAA “Climate Division” data http://www.cefa.dri.edu/Westmap/ Red = annual, blue = moving 25-year mean annual
Historical Climate Division P data:WY-04 Bighorn http://www.cefa.dri.edu/Westmap/ Red = annual, blue = moving 25-year mean annual
Outline • Is climate changing? • Are we affecting it? • Can we predict it? • Recent climate projections? • Impacts to hydrology and operations? • Factoring it into longer-term planning?
Explaining Temperature Trends • “Attribution” Studies • Model past Climate for two cases: • ~All past “forcings” • Only past natural “forcings” • Compare Results to Obs. (globally)… • Need ~All “forcings” to explain observed Fig. Andrea Ray
Outline • Is climate changing? • Are we affecting it? • Can we predict it? • Recent “climate projections”? • Impacts to hydrology and operations? • Factoring it into longer-term planning?
Making Climate Projections:steps before global climate modeling Econ/tech storylines model emissionscenarios model atmosphericconcentrations GCM climate Fig. P. Chris Milly
Global Climate Modeling objectives • Show energy moving from equator to poles through hydrologic cycle. • Huge amounts of water and heat move around the planet • Evaporation, Ocean Currents
More certain results: Temperature Fig. IPCC (2007)
More certain results:Atmospheric Water, large areas Atmospheric water content anomaly, 30S-30N over ocean; GFDL GCM; SMMR,SMM/I observations (Held and Soden, 2006) Fig. P. Chris Milly
Less certain results:Precipitation, local/regional areas Fig. David Yates
Outline • Is climate changing? • Are we affecting it? • Can we predict it? • Recent climate projections? • Impacts to hydrology and operations? • Factoring it into longer-term planning?
Temperature, three “scenarios”, results from multiple models Fig. IPCC (2007)
Precipitation, one “scenario” (A1b), results from multiple models Change in mean-annual (%),2090-2099 from 1980-1999 Fig. IPCC (2007)
Downscaling: relating GCM outputs to local/regional change http://gdo-dcp.ucllnl.org/downscaled_cmip3_projections/ • Developers • Santa Clara University (Ed Maurer) • Reclamation • LLNL • Funding • Reclamation • DOE NETL
Archive Scope • Variables • Precip rate (mm/d) • Mean Daily Temp(°C) • Attributes • Monthly, 1950-2099 • 1/8°, contiguous U.S. • Model Membership • projected SRES paths A1b, A2, B1 • Simulated past climate (i.e. “20th Century Climate Experiment”) …led to 112 projections selected for inclusion in archive
Change in mean-annual T (ºC),2041-2070 from 1971-2000,middle change among 112 projections, at every downscaled location
Change in mean-annual P (in/yr),2041-2070 from 1971-2000,middle change among 112 projections, at every downscaled location
Focusing on Bighorn area… 1). From website, download monthly “mean-area” Tair & P time series for all 112 projections. 2). Compute historical-to-future period changes in mean-annual, mean-area T & P for every projection. Use 1971-2000 as historical reference period.
2010-2039 2040-2069 2070-2099 Consider spread of projected changes foro T and P individually. (Highlighting10 and 90 percentile changes…)
2010-2039 2040-2069 2070-2099 Now consider spread of paired changes… yellow-area shows intersected 10/90 percentile ranges
2010-2039 2040-2069 2070-2099 Consider spread of paired changes in T and P
2010-2039 2040-2069 2070-2099 Consider spread of paired changes in T and P
Outline • Is climate changing? • Are we affecting it? • Can we predict it? • Recent “climate projections”? • Impacts to hydrology and operations? • Factoring it into longer-term planning?
Potential Natural Impacts • Based only on warming… • less snowfall, more rainfall • less snowpack, more runoff during winter • less snowpack, less runoff during spring • less snow area, more watershed participating in winter runoff events relevant to local flood control • earlier greenup, longer growing seasons • increased crop water demand based on T increase • But, not sure whether CO2 increases will counter/amplify • warmer aquatic environments
Projected Runoff Impacts…“nearby” basin (Upper Missouri) Reclamation R&D study (FY08, ongoing) Collaboration with Univ CO, Univ AZ, NWS Missouri Basin RFC and Colorado Basin RFC
Potential Operations Impacts • Less “controllable” water supply if… • Increased winter runoff (decreased spring runoff) combined with no reduction in winter flood-space causes winter runoff to be spilled rather than conserved • Different release schedules to accommodate… • earlier greenup, longer growing seasons • Changes in crop water demand • Management of aquatic environments under warming • Others?
Outline • Is climate changing? • Are we affecting it? • Can we predict it? • Recent “climate projections”? • Impacts to hydrology and operations? • Factoring it into longer-term planning?
Some scoping questions for factoring climate change into planning analyses… Reclamation has recent experience with Options 3 and 4 START END Question 1) Is climate relevant to the proposed project? No Option 5: Quantitative Effects Analysis, where disclosure is based on a projected climate scenario rather than continued recent climate Significant Sensitivity? Option 1: No Analysis Yes No Options 4 and 5 include the same Literature Review as in Option 3. Yes Yes Option 4: Quantitative Sensitivity Analysis… Question 2) Is look-ahead relevant on a climate change time scale? Question 7) Should effects disclosure be based on projected climate change? No Don’t Know IPCC 2007: (a) climate is generally assessed over a 20- to 30-year period; (b) climate change is generally measured as statistical changes between periods of 10 years or longer. (http://ipcc-wg1.ucar.edu/wg1/Report/AR4WG1_Pub_Annexes.pdf) Yes MP, PN, TSC Yes Question 3) Are regional projections of climate change available? Question 6) Is look-ahead more than ~15 to 20 years? Option 2: Literature Review… Option 3: Qualitative Analysis… No No All Regions, TSC Yes No Question 4) Do regional projections suggest significant change? Question 5) Is it preferable to follow lead of partner agency? Option 6: Follow lead of Partner-Agency No Yes Yes
Analyzing Operations under Climate Change(Option 4 example, MP OCAP/ESA study) “Bracketing” climate projections… Given: Climate projection(s) of monthly T and P (downscaled) Rainfall-runoff simulation analysis under each climate projection... Consumptive Use modeling wasn’t done… choice was rationalized assuming that demands wouldn’t necessarily change at “district-level” given management flexibility. Natural Responses, Social Responses, Operational Constraints No operations constraint adjustments made (e.g., monthly flood control rules, environmental/instream demands) Operations Response Operations modeling followed, reflecting supply changes under each projection. Delta levels, Delta water quality, and reservoir water temperature modeling Operations-dependent Response http://www.usbr.gov/mp/cvo/ocapBA_2008.html#appendices, Appendix R
Climate Projection Selection:Rationale developed for MP OCAP • Given: available downscaled projections • http://gdo-dcp.ucllnl.org/downscaled_cmip3_projections/ • We don’t know the “right” projections, therefore consider all CMIP3 projections as fair game. • We cannot classify emissions paths as more/less likely. • Its not obvious how to classify GCMs as better/worse. • Gleckler et al. 2008, Reichler et al. 2008, Brekke et al. 2008 • Projections uncertainty doesn’t necessarily diminish after determining a “worse” set of GCMs and discarding their projections. • Brekke et al. 2008 http://www.usbr.gov/mp/cvo/ocapBA_2008.html#appendices, Appendix R
Projection Selection Factors • Periods: Future and historical (planning look-ahead determines future) • Climate Metric: for assessing “change” relevant to study (computed for all projections) • Location: where “spread” of changes from all projections is assessed, relevant to study • Change Range: subjective, within “spread” http://www.usbr.gov/mp/cvo/ocapBA_2008.html#appendices, Appendix R
Projection Selection Factors:MP OCAP Choices • Periods: 1971-2000, 2011-2040 (consultation horizon is through 2030) • Climate Metric: Period Mean-Annual Tair & P • Location: “Above Folsom” (sensitivity interest on change in water supply, Sierra Nev. runoff) • Change Range: 10 to 90 %-tile DTair, DP (desire to represent broad set of possibilities) http://www.usbr.gov/mp/cvo/ocapBA_2008.html#appendices, Appendix R
Implementing Selection Factors:Step 1) Survey projections “Above Folsom” 1a. From website, download monthly Tair & P time series. 1b. Compute historical and future period “climate metrics” for every projection. 1c. Compute historical-to-future period changes in “climate metric” for every projection. http://www.usbr.gov/mp/cvo/ocapBA_2008.html#appendices, Appendix R
Step 2) Identify rank-threshold DTair and DP http://www.usbr.gov/mp/cvo/ocapBA_2008.html#appendices, Appendix R
Step 3) Overlay rank-threshold DTair and DP on scatter paired changes http://www.usbr.gov/mp/cvo/ocapBA_2008.html#appendices, Appendix R
Result: range of future climates represented by set of bracketing projections
Questions? Levi Brekke Reclamation, Technical Service Center lbrekke@do.usbr.gov