Download
1 / 74
740 likes | 917 Views
Coachella Valley 2011 Competitiveness?. John Husing, Ph.D. Economics & Politics, Inc. After Losing 8.36 Million Jobs … U.S. Job Creation Is Crawling Back. +23.1%. Pattern of Likely Recovery. x. x. . U. V.

E N D
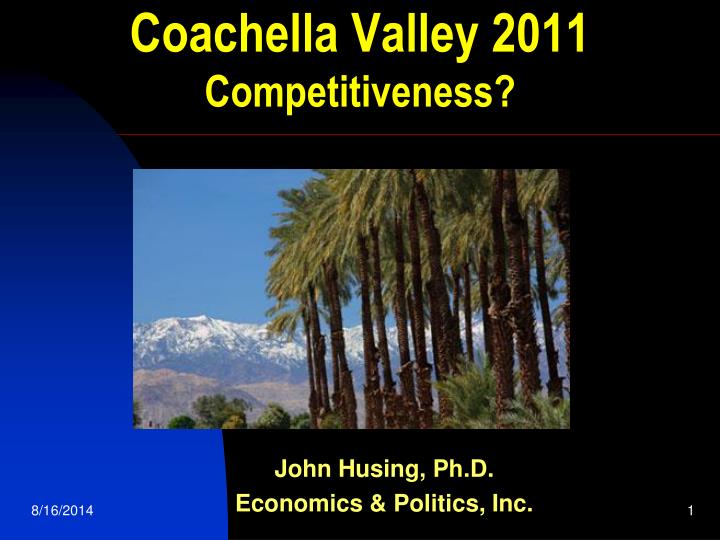
Coachella Valley 2011Competitiveness? John Husing, Ph.D. Economics & Politics, Inc.
After Losing 8.36 Million Jobs …U.S. Job Creation Is Crawling Back +23.1%
Pattern of Likely Recovery x x U V
So. CA Job Change, 1991-2011e +4.2% -488,700 -794,400 -9.2%
Inland Empire Job Change, 1984-2011e -0.6% +20,600 -167,900 -13.0%
Coachella Valley, Job Changes -1,879 -14,121 -13.0%
What About the Future? … Look At Competitiveness
Home Prices8th Lowest of 9 MarketsIndio 5th Lowest of 9 Markets
State Taxes 2nd Highest Highest 2nd Highest Highest Highest Highest
State Regulatory Environment Policy Conflict: Environment vs. Jobs
Public Health Blue Collar Sectors Bring Rising Asthma & CancerRisk From Airborne Toxics
Social Justice Blue Collar Sectors Hurt Modest Income Families Living Near Factories, Rail Yards, Ports, Freeways
California Solution Single Issue Regulatory Agencies CA Air Resources Board South Coast Air Quality Management District CA Environmental Protection Agency CA Water Resources Control Board & More
Two Results 1. Air Quality Is Improving
2. Downward Pressure On Blue Collar Jobs Blue CollarWork Is Much of Our Workforce’s Best Chance To Reach The Middle Class
Few Training Barriers To Beginning Employment Mining ($96,996) Blue Collar Manufacturing ($47,933) Blue Collar Logistics ($46,665) Blue Collar Wholesale Trade ($43,492) MedianBlue Collar Construction ($41,453) Blue Collar Retail Trade ($28,840) Gaming ($28,385) Hotel/Motel ($24,019) Agriculture ($22,793) Eating & Drinking ($15,132) $13,000 Gap
Results Of Job Suppression • Unemployment Higher Than It Needs To Be • Underemployment A Constant Difficulty • Lack of Access to Jobs Leading to the Middle Class • Health Issues of Poverty • Divorce • Spousal Abuse • Drug & Alcohol Abuse • Suicide • Lack of Timely Medical Care Public Health Issues!
Suppressing Blue Collar Jobs Is Also A Social Justice Issue Over 60% Of These Populations Also Stopped Their Educations With High School or Less Schooling
Public Policy Dilemma Lack of Blue Collar Jobs & Poverty Are Health & Social Justice Issues Clean Air, Asthma & Cancer Are Health & Social Justice Issues
After Years Of Focus onConcentrating Solely On The Environment Job Creation Is Our Forgotten Priority!
Competitiveness Coachella Valley C California F-
Gold Mine Theory Secondary Tier Primary Tier
Economic Base Grades • Competitiveness D thanks to CA • Construction • Hotels & Conventions • Tourism • Tourist Shoppers • Agriculture • Clean Tech • Creative Arts • Distribution • Retirees • Health Care • Manufacturing
Existing Homes Sales Remain Strong … Thanks To Short Sales/ Foreclosures
New Homes Sales Headed For A Record in 2011 … Thanks To Short Sales/ Foreclosures
New Home Price Back To 2004Level … Well Above Existing Homes
Foreclosures Issue 1,086,305 Homes In Inland Empire 35.4% All Homes
Assessed Valuation … Next Move Is UP?
Soaring CV Housing AffordabilitySets A Record & Drives Demand 64% 14%
Economic Base Grades • Competitiveness D thanks to CA • ConstructionD- • Hotels & Conventions • Tourism • Tourist Shoppers • Agriculture • Clean Tech • Creative Arts • Distribution • Retirees • Health Care • Manufacturing
Hotel Rates, Coming Back! 2nd quarter 2011 Coachella Valley hotel occupancy up 14.8% Average room rate up 5.4% Palm Springs Desert Community Convention Bureau Corporate Meetings & Conventions Coming Back Labor Day hotel occupancy is 25% higher than 2010 Wheeler’s Desert Letter
Airport Volume Flat Need More Flights To Compete With Phoenix-Scottsdale
Economic Base Grades • Competitiveness D thanks to CA • Construction D- • Hotels & Conventions C+ • Tourism C+ • Tourist Shoppers C • Agriculture • Clean Tech • Creative Arts • Distribution • Retirees • Health Care • Manufacturing
Economic Base Grades • Competitiveness D thanks to CA • Construction D- • Hotels & Conventions C+ • Tourism C+ • Tourist Shoppers C • AgricultureA • Clean Tech • Creative Arts • Distribution • Health Care • Retirees • Manufacturing
Clean Energy Initiatives Demand Property Assessed Clean Energy Financing (PACE) Palm Desert Municipal Program AB 811 Net Metering Development Skill Training To Work In the Industry Electric Vehicle Production