Download
1 / 20
200 likes | 374 Views
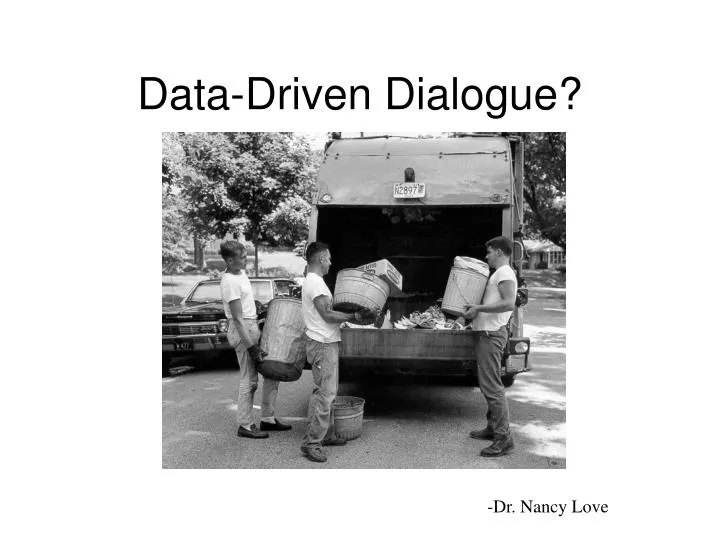
Data-Driven Dialogue?. -Dr. Nancy Love. “Just the Facts Ma’am. Facts are measurable. Facts can be replicated. Facts can be compared. Facts can motivate change. Facts ask us to fix the problem, not the blame. Consensogram Questionaire.

E N D
Data-Driven Dialogue? -Dr. Nancy Love
“Just the Facts Ma’am • Facts are measurable. • Facts can be replicated. • Facts can be compared. • Facts can motivate change. • Facts ask us to fix the problem, not the blame.
Consensogram Questionaire Please respond on a scale of 0 - 100 in increments of 10. 0 is the lowest. 100 is the highest. 1. To what degree do you believe in the need for data-driven dialogue? 0 10 20 30 40 50 60 70 80 90 100 2. To what extent is this statement true for your school? There is a systematic reliance on hard data (performance data, including data for subgroups) and survey data as a basis for decision making at the classroom, school, and district level. 0 10 20 30 40 50 60 70 80 90 100
3. Where on the scale do you rate your own skills in facilitating data-driven dialogue? 0 10 20 30 40 50 60 70 80 90 100
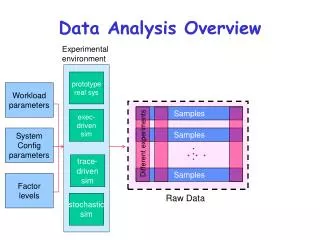
Data Driven Decision-Making?Or Teachers Talking About the Truth! • Before we begin: • With what assumptions are we entering? • What are some predictions we are making? • What are some questions we are asking?
Meets and Exceeds: 60% - Olympia • 60% - Not Low Income, State • No difference in scores
Meets and Exceeds: 57% Olympia • 65% State • Difference: Below - 8%
Meets and Exceeds: 54% Olympia • 64% State • Difference: Below - 10%
Comparing Apples to Oranges OR What’s a Quartile?
ACT Percentile Ranks by Quartile Class of 2003
Social Science .75 .84 Reading .84 .79 .75 Mathematics Science Reasoning .79 .78 .75 .79 .72 Writing
ACT Prairie State Exam Terra Nova
Monitor results. Commit to student learning vision and standards. Take action. Develop a learner-centered systemic action plan. Collect and analyze student learning and other data Uncover a learning-centered problem. Set measurable student learning goals. Where are we now? What’s Next?
Meets and Exceeds : 60% Olympia • 63% State • Difference: Below - 2%