Download

1 / 39
430 likes | 583 Views
Energy and Society. Energetics of Human Societies. We are currently living off of stored energy capital of millions of years ago. The storage of organic matter in sediments and fossil deposits created the concentration of petrochemical fossil fuels

E N D
Energetics of Human Societies • We are currently living off of stored energy capital of millions of years ago. • The storage of organic matter in sediments and fossil deposits created the concentration of petrochemical fossil fuels • There are low and high level societies which require different levels of energy consumption to maintain their needs: • MDC are high • LDC are low
Energy becomes an environmental problem • The oil crises of the early 1970s marked a transition where we began to realize the social, political and economics costs of such a heavy dependence on petroleum. • Oil prices were low in the 1980s and 1990s but have steadily risen since thyen.
World Oil Prices 1973-2003 This has increased domestic pressure for drilling-the dispute over drilling in the Arctic National Wildlife Refuge
Energy Crisis or Energy Predicament? (ongoing problem that can result in crisis if not attended Four dimensions of the energy predicament. • Source Problems-how much do we have? • Scale of energy consumption (population growth and economic growth) • Global Policy and geopolitical problems • Sink Problems
Commercial Energy • 3 ways to define Energy: • Non-renewable: exist in a fixed quantity in the earth’s crust and can be used up (oil, gas, fossil fuels). • Renewable: resources in unlimited supply (Solar, wind, tides, hydro) • Potentially Renewable: resources that can be used, but not faster than they can be replenished (biomass)
Commercial Energy • 75% nonrenewable: oil, natural gas, coal • 6% Nuclear energy • 6% renewable-hydropower, wind, solar, and geothermal • Also biomass
Will new discoveries always push the peak forward? • the estimated crude reserves in ANWR-largest known in US-would meet world demand only six months. • 2) Saudi Arabia alone could only supply world for ten years • Shell Oil has forecast that alternative energies will be competitive with petroleum by 2020.
Scale of Consumption: Population Growth, Economic Development, and Inequity • MDCs have about 1/5th of the world’s people but consume almost ¾’s of the world’s energy. Americans are 5% of the world’s population and use 24% of the energy
On average, one American consumes as much energy as • 2 Japanese • 6 Mexicans • 13 Chinese • 31 Indians • 128 Bangladeshis • 307 Tanzanians • 370 Ethiopians.
Policy and Geopolitical Problems • The US has promoted a “supply side” policy of keeping oil cheap.
Government Subsidies for Oil Companies • Non-oil industries are taxed at a rate of 18 percent, the oil industry is taxed at a mere 11 percent. • This reduced rate equates to $2 billion in federal corporate income tax benefits per year. • They also benefit from low state and local sales tax rates on gasoline, an indirect subsidy exceeding $4 billion a year. • Direct government funding of oil and motor vehicle infrastructure and services tops off at $45 billion a year. • And taxpayers, not the oil industry, are left to pay the cleanup bill for oil-related health and environmental damage, which could be as high at $232 billion annually.
More on Subsidies • Defense of Persian Gulf Oil Supplies. Defense of Persian Gulf oil shipments and infrastructure comprises two-thirds of the total high estimate, conferring a subsidy of $10.5 to $23.3 billion per year. • Provision of the Strategic Petroleum Reserve. Stockpiling oil to protect against supply disruptions provided between $1.6 and $5.4 billion in subsidies to oil markets in 1995. • Tax Breaks for Domestic Oil Exploration and Production. Three tax breaks benefiting oil exploration and production (the expensing of exploration and development costs, excess of percentage over cost depletion, and accelerated depreciation of oil-related capital) reduced oil industry tax payments by between $1.1 and $2.3 billion during 1995.
Support for Oil-related Exports and Foreign Production. Tax credits for foreign royalties paid, deferrals of U.S. income taxes due for multinational oil companies, and credit subsidies through the Export-Import Bank and the Overseas Private Investment Corporation, provide between $0.8 and $1.6 billion per year in subsidies for exports and foreign production.
The Sink Problems • Global warming already discussed. • Oil spills • http://www.youtube.com/watch?v=uzY92yFWKys
More on Oil Spills • Big oil tanker spills get the most publicity. • But between 50-90% of oil reaching oceans comes from land-waste oil dumped on land by cities, individuals, and industries ends up in streams
Energy: Hard paths and soft paths Amory Lovins Hard path-fossil fuels produced in centralized ways. Soft path- alternative energy sources produced in decentralized ways
Energy Consumption Behavior • Economic rational model: humans rationally respond to changing energy prices • Attitude behavioral model: education and information could change energy-use behavior • Energy consumption and intensity are far too complex to be accounted for by either model.
The Need for Energy Use Information • Household energy use is invisible and until recently difficult to quantify and analyze. • But more feedback mechanisms are technologically available, i.e. little screens on your refrigerator and dryer that tell you how much energy they are using and the cost. • Refrigerators are hard to do without (but don’t stand around with the door open a long time!) but dryers have a cheap solar substitute, the clothes line (clothes dryers are 8-10% of household energy consumption)
Thus • Accurate feedback • Modeling (videotapes showing people what to do have been effective) • “Framing” messages-Americans more receptive to “energy efficiency” than energy conservation
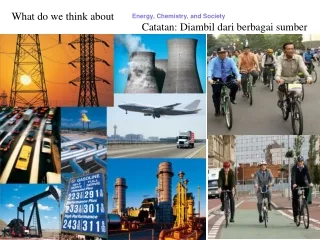
The Fossil Fuels • Coal • Petroleum • Natural Gas
Fossil Fuels: Coal • High net energy yield • Most abundant and dirtiest of all fossil fuels • Harmful environmental and health effects associated with extraction, processing, and use • Extraction pollutes water supplies • Contributes to global warming
Coal Facts • Percentage of the world's coal reserves located in the U.S.: 25% • Coal's percentage of U.S. energy reserves: 90% • Percentage of electricity in the U.S. generated by coal: 50% • Cost of a megawatt of energy produced by coal: $20 to $30 • Cost of a megawatt of electricity produced from natural gas: $45 to $60 • 1980 U.S. coal production in million of tons: 890 • 2001 U.S. coal production in million of tons: 1,121 • Percentage of coal production from surface mining, 2000: • 65% Percentage decline in coal industry employment 1986 to 1997: -47.29%
A Crimp in the Eastern Coal Supply Chain? . • Litigation and permitting delays sidetrack mountaintop removal and longwall mines • Several temporary shutdowns in 2003 due to fires, accidents, or MSHA regulations • Six major bankruptcies over 24 months, four ongoing, affect prices and deliveries
In the Long Term (to 2025) . . . • Electricity demand will rise • Natural gas prices in real dollars will rise • Coal mining productivity will improve further, keeping coal prices relatively low • Emission caps will shift even more demand to the West • Industrial coal demand and coal exports decline, coal imports rise
Figure ES3. Share of Electric Power SectorNet Generation by Energy Source, 2004 vs. 2005
A typical (500 megawatt) coal plant burns 1.4 million tons of coal each year. There are about 600 U.S. coal plants.
Natural gas is a gaseos fossil fuel consisting primarily of methane. Found in oil fields and natural gas fields.
Fossil Fuels: Natural Gas, the transitional fossil fuel For an equivalent amount of heat, burning natural gas produces about 30% less carbon dioxide than burning petroleum and about 45% less than burning coal. • In 1999, Natural gas eclipsed coal as a world source of energy, 2nd to oil
Hyper Car • http://www.youtube.com/watch?v=ZiA4cpJb0uw&mode=related&search=Amory%20Lovins%20Rocky%20Mountain%20Institute%20Winning%20the%20Oil%20Endgame%20Fiberforge%20Hypercar
http://www.youtube.com/watch?v=tXUnlcLJzLM&mode=related&search=http://www.youtube.com/watch?v=tXUnlcLJzLM&mode=related&search=
Amory Lovins • http://www.youtube.com/watch?v=6PcVOD14nOE