Download
1 / 7
400 likes | 937 Views
RNA-sequencing (RNA-seq) has a wide range of applications, and there is no optimal pipeline for all cases. We review all of the major steps in RNA-seq data analysis, including quality control, read alignment, quantification of gene and transcript levels, differential gene expression, functional profiling, and advanced analysis. They will be discussed later

E N D
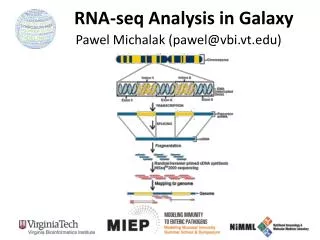
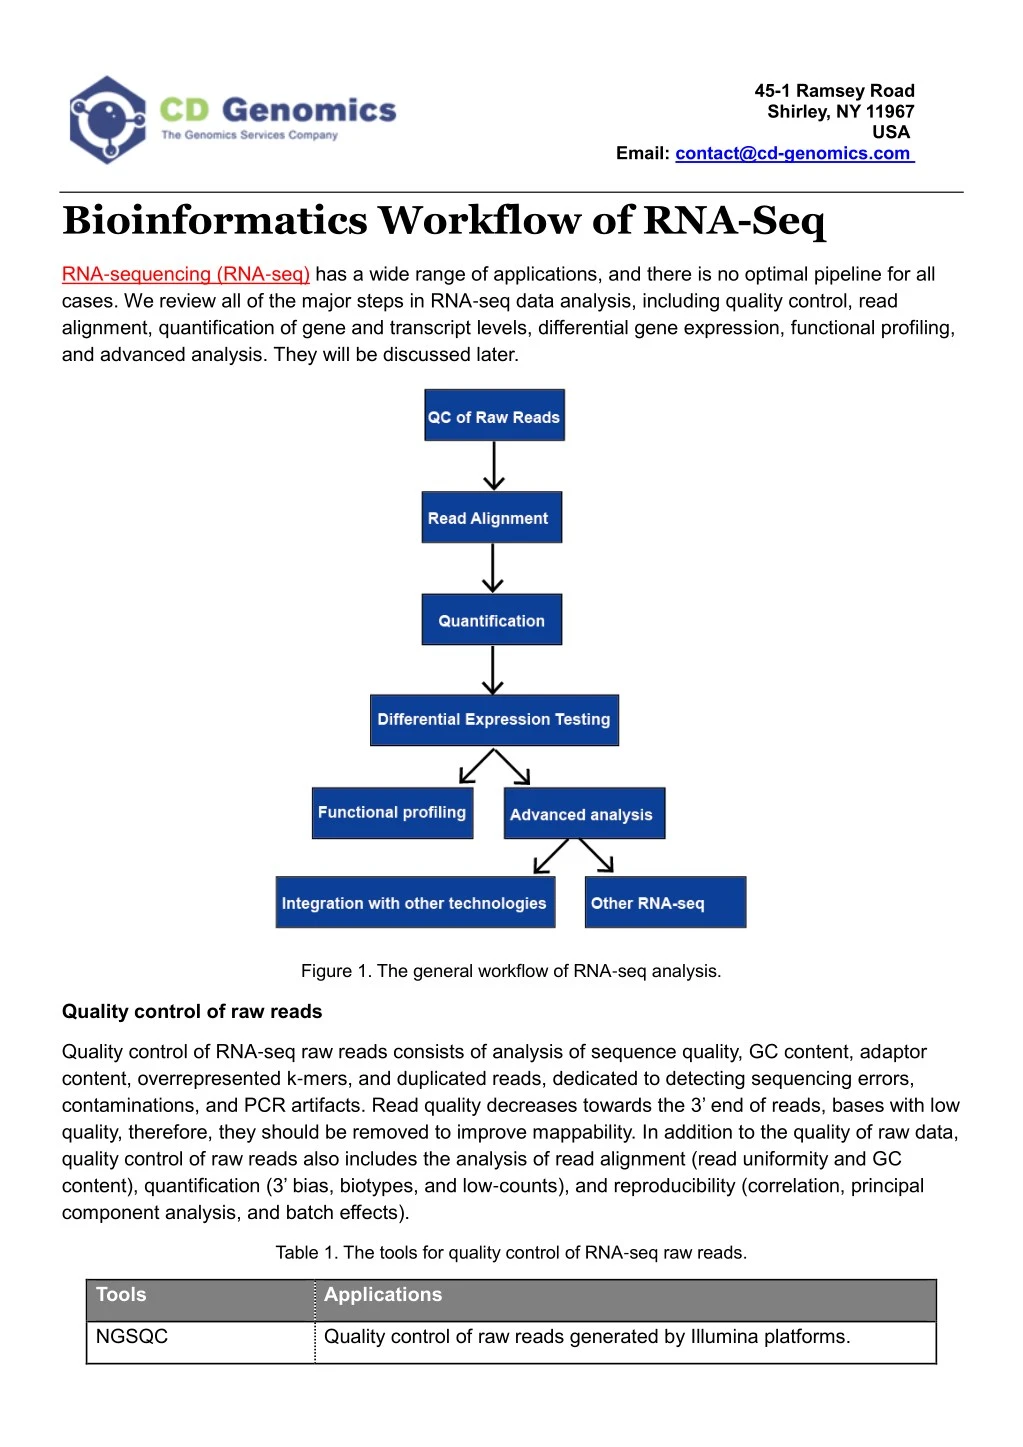
45-1 Ramsey Road Shirley, NY 11967 USA Email:contact@cd-genomics.com Bioinformatics Workflow of RNA-Seq RNA-sequencing (RNA-seq) has a wide range of applications, and there is no optimal pipeline for all cases. We review all of the major steps in RNA-seq data analysis, including quality control, read alignment, quantification of gene and transcript levels, differential gene expression, functional profiling, and advanced analysis. They will be discussed later. Figure 1. The general workflow of RNA-seq analysis. Quality control of raw reads Quality control of RNA-seq raw reads consists of analysis of sequence quality, GC content, adaptor content, overrepresented k-mers, and duplicated reads, dedicated to detecting sequencing errors, contaminations, and PCR artifacts. Read quality decreases towards the 3’ end of reads, bases with low quality, therefore, they should be removed to improve mappability. In addition to the quality of raw data, quality control of raw reads also includes the analysis of read alignment (read uniformity and GC content), quantification (3’ bias, biotypes, and low-counts), and reproducibility (correlation, principal component analysis, and batch effects). Table 1. The tools for quality control of RNA-seq raw reads. Tools Applications Quality control of raw reads generated by Illumina platforms. NGSQC
45-1 Ramsey Road Shirley, NY 11967 USA Email:contact@cd-genomics.com Quality control of raw reads generated by any platforms. FastQC FASTX-Toolkit Discard of low-quality reads, trim adaptor sequences, and elimination of poor quality bases. Trimmonmatic Picard Quality control in read alignment, including the determination of read uniformity and GC content. RSeQC Qualimap NOISeq Provide useful plots for quality control of count data. EDASeq Read alignment There are generally three strategies for read alignment, genome mapping, transcriptome mapping, and de novo assembly. Regardless of whether a genome or transcriptome reference is available, reads may map uniquely or be assigned to multiple position in the reference, which are referred to as multi-mapped reads or multireads. Genomic multireads are generally due to repetitive sequences or shared domains of paralogous genes. Transcriptome multi-mapping arises more often due to gene isoforms. Therefore, transcript identification and quantification are important challenges for alternatively expressed genes. When a reference is not available, RNA-seq reads are assembled de novo using packages such as SOAPdenovo-Trans, Oases, Trans-ABySS, or Trinity. PE strand-specific and long-length reads are preferred since they are more informative. Emerging long-read technologies, such as PacBio SMRT technology, can generate full-length transcripts for most genes. Figure 2. Three basic strategies for RNA-seq read mapping (Conesa et al. 2016). Abbreviations: GFF, General Feature Format; GTF, gene transfer format; RSEM, RNA-seq by Expectation Maximization.
45-1 Ramsey Road Shirley, NY 11967 USA Email:contact@cd-genomics.com Table 2. The comparison of genome-based and de novo assembly strategies for RNA-seq analysis. Genome-based De novo assembly Method Alignment to a reference genome Not using a reference genome Advantages Efficient computing Reference genome is not required ⚫ ⚫ Eliminates contaminating reads Correct alignment of reads to known splice site is not required ⚫ ⚫ Very sensitive and can assemble transcripts of low abundance ⚫ Trans-spliced transcripts can be assembled ⚫ Can discover novel transcripts without annotation ⚫ Disadvantages Requires high-quality reference genome More computational intense ⚫ Sensitive to sequencing error ⚫ Recommended depth Approximately 10x Beyond 30x Table 3. The public sources of RNA-seq data. Transcriptomic Database Data Type Website Gene Expression Omnibus (GEO) Both microarray and sequencing data https://www.ncbi.nlm.nih.gov/ge o/ ArrayExpress Both microarray and sequencing data https://www.ebi.ac.uk/arrayexpre ss/ https://www.encodeproject.org/ ENCODE: Encyclopedia of DNA Elements Public ENCODE Consortium data Sequence Read Archive (SRA) Sequencing data https://www.ncbi.nlm.nih.gov/sra Sequencing data https://www.ebi.ac.uk/ena European Nucleotide Archive (ENA) Sequencing data https://www.ddbj.nig.ac.jp/dra DDBJ Sequence Read Archive (DRA) Transcript quantification Transcript quantification can be used to estimate gene and transcript expression levels. Table 4. The common tools for transcript quantification.
45-1 Ramsey Road Shirley, NY 11967 USA Email:contact@cd-genomics.com Tools Principles and Applications TopHat Using an expectation-maximization approach that estimates transcript abundances. Designed to take advantage of PE reads, and may use GTF information to identify expressed transcripts, or can infer transcripts de novo from the mapping data alone. Cufflinks RSEM Quantify expression from transcriptome mapping. eXpress Allocate multi-mapping reads among transcript and output within-sample normalized values corrected for sequencing biases. Sailfish kallisto Provides an efficient way of estimating transcript expression from SE reads with a low memory and computing cost. NURD Figure 3. The tools for isoform expression quantification. Differential expression testing Differential expression testing is used to evaluate if one gene is differentially expressed in one condition compared to the other(s). Normalizing methods need to be adopted before comparing different samples. RPKM and TPM normalize away the most important factor, sequencing depth. TMM, DESeq, and UpperQuartile can ignore highly variable and/or highly expressed features. Other factors that interfere with intra-sample comparisons involve transcript length, positional biases in coverage, average fragment size, and GC content, which can be normalized by tools, such as DESeq, edgeR, baySeq, and NOISeq. Batch effects may still be present after normalization, which can be minimized by
45-1 Ramsey Road Shirley, NY 11967 USA Email:contact@cd-genomics.com appropriate experimental design, or removed by methods such as COMBAT or ARSyN. Table 5. The normalization tools for differential expression testing. PackageRead count distribution assumptions Input Replicates Normalization DESeq Negative binomial distribution Raw counts No Library size edgeR Raw counts Yes Library size Bayesian methods for negative binomial distribution TMM RLE Upperquartile baySeq Raw counts Yes Library size Bayesian methods for negative binomial distribution Quantile TMM NOISeq Non-parametric No Library size Raw or normalized counts RPKM TMM Upperquartile Alternative splicing analysis Alternative splicing (AS) is a posttranscriptional process which generates different transcripts from the same gene and is vital in response to environmental stimuli by producing diverse protein products. Multiple bioinformatics tools have been developed to detect AS from experimental data. The comparison of these detection tools using RNA-seq data was conducted by Ding in 2017, and the results are shown in Table 7. They have demonstrated that TopHat and its downstream tool, FineSplice, are the fastest tools, whereas PASTA is the slowest program. Furthermore, AltEventFinder can detect the highest number of junctions, and RSR detects the lowest number of junctions. Other tools, such as TopHat, are likely to detect false positive ones. Of the two tools that detect differentially spliced isoforms, rMATS is faster than rSeqDiff but detects less differentially spliced isoforms than rSeqDiff. Table 7. Detected AS types or differentially spliced isoforms of these tools (Ding et al. 2017). Number of Differentially Spliced Isoforms Running Time (Minutes) Maximum Memory (GB) Data Source Maximum CPU (%) Number of SJs Tool Alt Event Finder ENCODE 12 1.364 100 30569 N/A
45-1 Ramsey Road Shirley, NY 11967 USA Email:contact@cd-genomics.com Number of Differentially Spliced Isoforms Running Time (Minutes) Maximum Memory (GB) Data Source Maximum CPU (%) Number of SJs Tool SpliceMap ENCODE 42 3.1 99.9 11882 N/A FineSplice ENCODE 2 1.364 100 8577 N/A RSW N/A N/A N/A N/A N/A N/A RSR ENCODE 24 3.968 100 3143 N/A PASTA ENCODE 350 2.17 101 14675 N/A mouse used in RSW study rMATS 44 26.536 274 N/A 17 SOAPsplice ENCODE 123 5.332 99.7 10381 N/A SplicePie N/A N/A N/A N/A N/A N/A SplicingCompass N/A N/A N/A N/A N/A N/A TopHat ENCODE 1.75 1.364 100 9619 N/A TrueSight ENCODE 229 2.914 571 12360 N/A NSMAP N/A N/A N/A N/A N/A N/A mouse used in RSW study rSeqDiff 115 0.186 119 N/A 203 rSeqNP N/A N/A N/A N/A N/A N/A Visualization There are many bioinformatics tools for the visualization of RNA-seq data, including genome browsers, such as ReadXplorer, UCSC browser, Integrative Gnomics Viewer (IGV), Genome Maps, Savant, tools specifically designed for RNA-seq data, such as RNAseqViewer, as well as some packages for differential gene expression analysis that enable the visualization, such as DESeq2 and DEXseq in Bioconductor. Packages, such as CummeRbund and Sashimi plots, have also been developed for visualization-exclusive purposes. Functional Profiling The latest step in a standard transcriptomics study is generally the characterization of the molecular functions or pathways in which differentially expressed genes are involved. Gene Ontology, Bioconductor, DAVID, or Babelomics contain annotation data for most model species, which can be used for functional annotation. As for novel transcripts, protein-coding transcripts can be functionally annotated using orthology with the help of databases such as SwissProt, Pfam, and InterPro. Gene
45-1 Ramsey Road Shirley, NY 11967 USA Email:contact@cd-genomics.com Ontology (GO) allows for some exchangeability of functional information across orthologs. Blast2GO is a popular tool that allows massive annotation of complete transcriptome against a variety of databases and controlled vocabularies. The Rfam database contains most well-characterized RNA families that can be used for functional annotation of long non-coding RNAs. Advanced analysis The advanced analysis of RNA-seq usually includes other RNA-seq and integration with other technologies, which is outlined in Figure 4. More information on applications of RNA-seq, please view this article Applications of RNA-Seq. Figure 3. The advanced analysis of RNA-seq data. References: 1. Conesa A, Madrigal P, Tarazona S, et al. A survey of best practices for RNA-seq data analysis. Genome biology, 2016, 17(1): 13. 2. Ding L, Rath E, Bai Y. Comparison of Alternative Splicing Junction Detection Tools Using RNASeq Data. Current genomics, 2017, 18(3): 268-277. 3. Grabherr M G, Haas B J, Yassour M, et al. Full-length transcriptome assembly from RNA-Seq data without a reference genome. Nature biotechnology, 2011, 29(7): 644.