Download
1 / 9

E N D
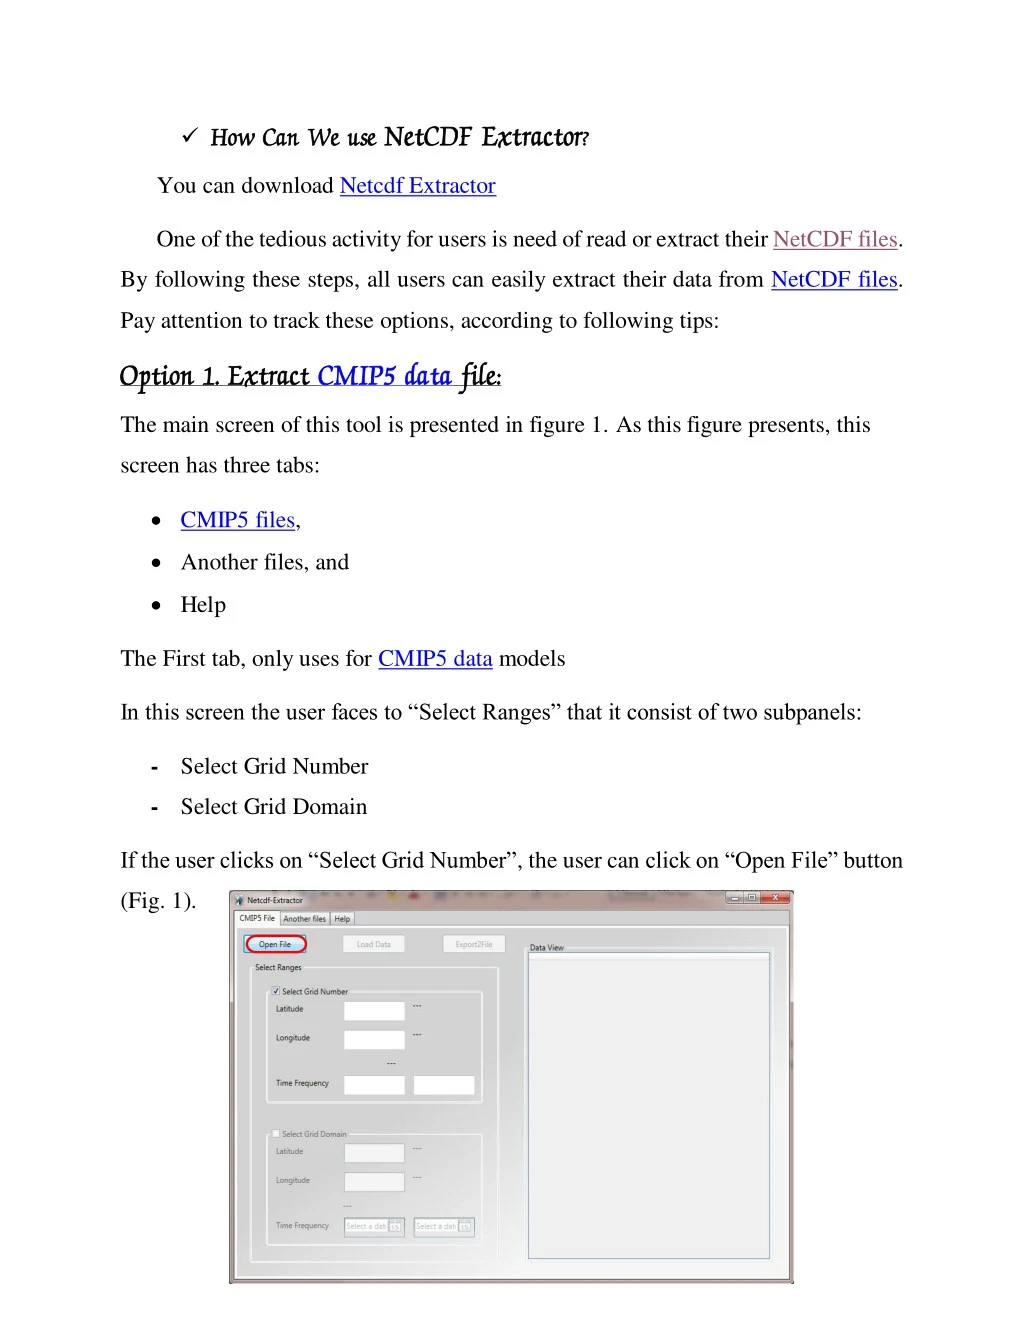
How Can We How Can We use use NetCDF NetCDF Extractor Extractor? ? You can download Netcdf Extractor One of the tedious activity for users is need of read or extract their NetCDF files. By following these steps, all users can easily extract their data from NetCDF files. Pay attention to track these options, according to following tips: Option Option 1 1.. Extract Extract CMIP5 data CMIP5 data file: file: The main screen of this tool is presented in figure 1. As this figure presents, this screen has three tabs: CMIP5 files, Another files, and Help The First tab, only uses for CMIP5 data models In this screen the user faces to “Select Ranges” that it consist of two subpanels: -Select Grid Number -Select Grid Domain If the user clicks on “Select Grid Number”, the user can click on “Open File” button (Fig. 1).
Browse specific CMIP5’s model from the system (Fig. 2). According to the selected file (Precipitation value of MIROC4h-rcp45…), after browsing the user can observe the range of latitude and longitude according to Fig. 3. In this Figure you can see the ranges in according to the selected model of CMIP5. It is necessary to select the ranges of data grids. Note that your input data should limit to the selected file’s attribute. In Fig. 3 you can see the ranges of selected file. In this example the whole latitude is located to [1: 320] and latitude is located to [1: 640]. In the “Time Frequency” option, user can type the frequency of time, according to the ranges that was showed above of this option (for example according to the browsed file, the entire time frequency in this sample is equal to [1:365], so user can type 1 to 365.
Due to the descriptions in Fig. 4, three values of attributes have filled with appropriate amounts. These are the information of grid number, so all of them are integer without float numbers.
While three attributes have been filled, then the user can click on the “Load Data”, see the Fig. 5. Then, the user can see the value of precipitation in the table that it is located in the right of the screen with header of “Data View”. Since the user enter a point with Lat: 221 and Lon: 275 with Time: 1:365, so in the table you can see all the data day by day. For example, 1 has 4.371684 and 2 has 3.87160,... By selecting the “Export2File” button, user can save the aim file in an Excel format file (Fig. 6). The unit of precipitation is the same as the main NetCDF file that the user browse it at the first step.
Since the CMIP5 data files follow a specific standard, therefore we can read NetCDF files in two way (Grid Number and Grid Domain). If a user click on “Select Grid Domain” checkbox, he/she can type the value of latitude and longitude of a desirable point (just for daily CMIP5 data) with time frequency of a specific period (Fig. 7). In Fig.7 you can see a sample that has filled in the blanks of Lat, Lon, and Time Frequency. In this sample the main range for latitude, longitude and time frequency are respectively equal to: [-89.57:89.57], [0:179.44], and [1/1/2006: 12/31/2006]. In Fig. 7, there is a sample for each attribute. According to this example the value of latitude is 36.26, longitude is 59.63 and the time frequency is 2/16/2006 to 12/31/2006. As Fig. 7 the Data View table present the date of precipitation value, day by day, according to selected time frequency.
Option Option 2 2. Extract . Extract other other data file data files s: : In the NetCDF Extractor, the user can also read another dataset format files, such as CRU, AgMERRA, CORDEX, and etc. In Fig. 8 we select AgMERRA dataset for an example. The format of AgMERRA dataset is .nc4. You can easily extract your aim point by “NetCDF Extractor Tool”. A sample was presented for better understanding this part of software, according to the movie help file. In this step, after clicking on the “Another Files”, user can select “Open File” button and browse the desirable data file. In this phase the user can see the list of variables, according to the basic AgMERRA file. In the list of variables there are some descriptions about
characteristics of the file. You can fill in the blanks, namely, variable’s name, origin and shape according to this descriptions. Let’s to review an example of AgMERRA data. In Fig. 8, we load minimum relative humidity that the name of this variable is “rhsmin” in AgMERRA datasets. Note, the rhsmin has three attributes in this “.nc.4” AgMERRA file. This amounts are shown in “List OfVariables” in Fig. 8. The allowed ranges are: time=1460, lat=128, and lon=256, so the user can fill the blanks according to this ranges. Be careful about the “Variable Name”, it should be equal to the name that it is located in the “List Of Variables”, see the Fig. 8 and “red line” that is assigned to “rhsmin”. For the “Origin” you should select three items, namely time, latitude and longitude and separate them by comma. For the “Origin”, fill the blank according to the specific range. In this sample it is equal to: [1, 93, 121], that Time 1, latitude93, and longitude121. The “shape” component is same as “Origin” component for the number of attributes, in this sample we write, Shape = [1460, 1, 1], it means the number of time is 1460, the number of lat is 1, and the number of lon is 1. Note to “Data View” table in the right position of Fig. 8, you can see that: [1, 1, 1]=60.89965057, it means that the value of minimum relative humidity in time=1, lat=1, and lon=1 is equal to 60.89965057. These values will continue up to the selected amount that user selected them in the “Origin” and “Shape” fileds.
For better understanding of the concept of “Shape”, pay attention to another example that is presented in Fig. 9. According to the Fig. 9, you can see that the value of “Shape” is equal to [1460, 4, 2]. Note to “Data View” table in Fig. 9, the number of attributes is start from [1, 1, 1], [1, 1, 2], then [1, 2, 1]…. This is so important that you perceive these amounts. This changes due to the amount of “Shape” field. Finally, user can save the output file in the Excel format file. As we mentioned, the user can extract other different datasets in .nc format such as CRU, AgMERRA, CORDEX, APHRODITE and etc. Help File Help File: :
The “Help” tab is the last tab in the “NetCDF Extractor” software. For better understanding view the movie help file. In this movie you can follow all the steps one by one. The Fig.10 present this screen. The user can easily watch the help movie and follow the steps to extract data. Note that: Note that: - The NetCDF Extractor software application permits to display and edit content of “.nc” files, however the ability of the tool for extracting huge database of regions is depend on user’s system RAM. -In every step, the user can easily convert nc data to Excel file.