Download
1 / 47
470 likes | 610 Views
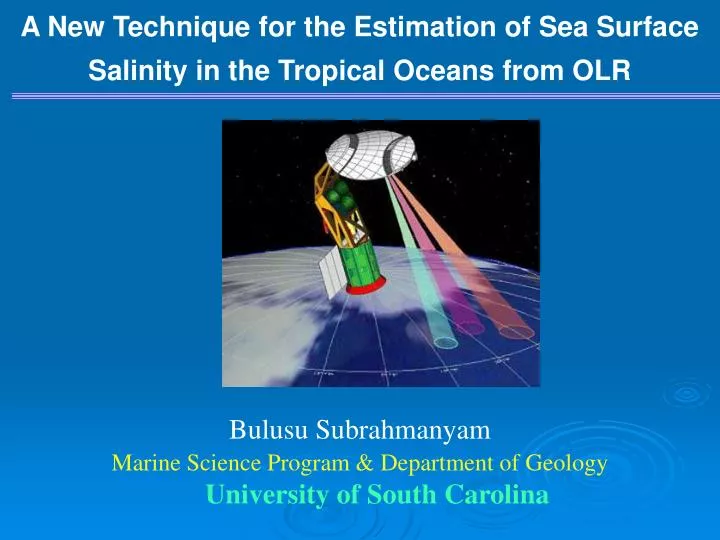
A New Technique for the Estimation of Sea Surface Salinity in the Tropical Oceans from OLR. Bulusu Subrahmanyam Marine Science Program & Department of Geology University of South Carolina. Infrared Images. cold upwelling water south of Cape Cod.

E N D
A New Technique for the Estimation of Sea Surface Salinity in the Tropical Oceans from OLR Bulusu Subrahmanyam Marine Science Program & Department of Geology University of South Carolina
Infrared Images cold upwelling water south of Cape Cod. Land and clouds have been added from the near IR. westward moving warm eddy Gulf Stream West Atlantic 15th June 1996 (NOAA/AVHRR)
Salinity from space • Two satellite missions – the US ‘Aquarius’ and the European Space Agency Soil Moisture and Ocean Salinity (SMOS) are planned for launch in 2008. • Provide the first global observations of SSS, covering Earth's surface once every 8 days • Deliver monthly 150-kilometer resolution SSS maps over a 3-year mission lifetime • Achieve SSS accuracy of 0.2 (psu): this is about a "pinch" (i.e., 1/6 of a teaspoon) of salt in 1 gallon of water
Aquarius Aquarius satellite is targeted for launch in 2009 for a three-year mission The Aquarius mission is being developed in an international partnership with Argentina’s space agency, Comision Nacional de Actividades Espaciales (CONAE) Passive Salinity Sensor L-Band Radiometer operating at 1.4 GHz (NASA) Active Surface Roughness Sensor L-Band Scatterometer operating at 1.2 GHz (NASA) Microwave Radiometer (MWR) (CONAE Instrument)
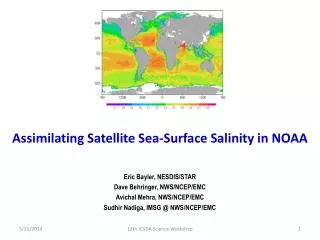
Mean Annual Distribution of Surface Salinity in PSU Average Salinities Atlantic 34.9 Pacific 34.6 Note: in general the surface salinities are higher in Atlantic than Pacific
North Indian Ocean • There are geographical similarities in Arabian Sea and Bay of Bengal. • semi enclosed basins • open to the equatorial Indian Ocean in the south • both forced by changing monsoon winds • receive similar amount of solar radiation • There are also striking dissimilarities between the two basins. • evaporation exceeds precipitation in the Arabian Sea • precipitation exceeds evaporation in the Bay • Annual rainfall in the Arabian Sea is ~ 1m; in the Bay varies between 1-3 m • Run off from rivers into Arabian Sea is meager, Bay receives annual runoff of 1.5x10¹² m3 • Arabian Sea is much saltier than Bay. • Strong stratification near the surface in the Bay.
ARABIAN SEA BAY OF BENGAL weak convective activity strong convective activity P-E > 0 P-E < 0 weak near-surfacestratification strong near-surfacestratification warm SST coolSST strong mixing and upwelling weak mixing and upwelling strong winds (Findlater Jet) weak winds
Technique for Retrieval of Ocean Surface Salinity • A new technique developed for retrieval of sea surface salinity (SSS) from space-borne satellite measurements of OLR through the Effective Oceanic Layer (EOL). • OLR is used to study the convection over the land and ocean. This is based on the idea is that intense convection over the ocean is associated with warmer surface temperatures maintained by low surface salinities formed due to large riverine input and compounded by convection-induced precipitation. • SSS estimated in this way may be useful in improving the existing climatologies at least for those parts of the world’s ocean where intense convection is the regular feature, such as the tropical Indian and Pacific Oceans.
Effective Oceanic Layer • The EOL is defined as the geopotential thickness (m2/s2) of the stratified layer and is computed from: • where is the mean specific volume anomaly (m3/kg) obtained from the temperature and salinity profile data over the pressure interval (dp). The integration is over the depth from surface to the depth (D) of stability maximum. • The integration is carried out over a constant depth of 30m uniformly in the Indian Ocean, as the depth of the stability maximum varies between 20 and 40m.
Objectives • We developed algorithms for retrieval of sea surface salinity (SSS) from space-borne satellite measurements of Outgoing Longwave Radiation (OLR). It is an inverse method to derive the SSS from OLR. • A preliminary assessment of the potential SSS observations from satellite observations of OLR through the “Effective Oceanic Layer (EOL) is presented for the Indian Ocean. • Given the sparse distribution of in situ SSS observations, it follows that even a threshold requirement of 1 PSU (Practical Scale Unit) over a distance of 1 degree for a time period of weekly or monthly will be useful in improving existing climatologies. • It is envisaged that errors in the SSS obtained from satellite derived OLR may come close to the threshold requirements. This means that satellite derived OLR seems capable of providing SSS values, at least for those parts of the ocean that are covered by thick clouds, such as the tropical Indian Ocean.
Objectives • To develop algorithms for the estimation of sea surface salinity (SSS) from space-OLR over the tropical oceans. • To validate the estimated SSS using in situ surface salinity observations along WOCE and Joint Global Ocean Flux Studies (JGOFS) sections, along ships of opportunity tracks where salinity is collected, and available time-series data sets and cruises data; • To refine the estimated SSS for advection and mixing through HYCOM (Hybrid Coordinate Ocean Model) simulations; • To utilize the estimated SSS data to study the seasonal and interannual variability of SSS and the associated upper ocean processes • To further utilize the estimated daily SSS to study the air-sea coupling during tropical cyclones and possibly help improving prediction of tropical cyclone tracks.
Data and Models • Daily OLR at 2.5°x2.5° grids from 1975 to 2003. • Monthly Southampton climatology E-P from 1980-2003 • Monthly CMAP precipitation from 1979-2003 • World Ocean Atlas 2001 Temperature and Salinity data • HYCOM model- surface currents are used to estimate advection and Mixing Processes • SSS physical model - to identify the lag between the OLR and SSS, between P-E and SSS, and between P and SSS, and its effect on the estimated SSS in the tropical Oceans
Based on WOA 98 and INSAT OLR during July in the Bay of Bengal
Scatter Plots in the Equatorial Indian Ocean (OLR vs EOL & EOL vs SSS)
Deviation of Estimate Sea Surface Salinity Anomalies from WOA98 During 1995
Deviation of Estimate Sea Surface Salinity Anomalies from WOA98 During 1996
Deviation of Estimate Sea Surface Salinity Anomalies from WOA98 During 1997
Deviation of Estimate Sea Surface Salinity Anomalies from WOA98 During 1998
The seasonal variation of estimated SSS based on these relationships agreed closely with that of WOA98 SSS with a deviation of ±0.5 PSS (Practical Salinity Scale) over the vast part of tropical Indian Ocean.
Physical Model Total mass of the enclosed volume of fluid Mass of just the salt molecules in the volume Time rate of change in volume’s Salinity Consider a volume of water in contact with the atmosphere, with no mixing or exchange. The average salinity of the volume (in terms of a mass ratio) is give as: We can write
Physical Model (Cont) H is thickness of our volume Assuming small variations in salinity and that H is large with respect to the net amount of water crossing the air-sea interface, we can write the above as: where P is the precipitation rate, E is the evaporation rate, is the density of the water, and A is the area of the volume in contact with the atmosphere. Using the definition of S and that where So and Ho are the mean salinity and layer thickness respectively. For ease in writing we will define R=P-E.
Physical Model (Cont) is frequency, and the circumflexes denote Fourier transformed variables. The model co-spectrum between S and (P-E) is given by: Here *'s denote the conjugate Cospectrum is totally imaginary Taking the Fourier transform of both sides of above equation: Phase between S and R is 90° (they are in quadrature) Model shows that for a mean annual cycle, a 90° phase lag between S anomalies and P-E anomalies as show up in a lag correlation as maximum at a lag of 3 months
Influence of tropical cyclones on Chlorophyll-a Chlorophyll-a concentrations (mg m-3) from IRS-P4 (OCEANSAT-1) Ocean Color Monitor (OCM)
MODAS Salinity Salinity estimated from OLR (NRL Modular Ocean Data Analysis System)
Heat and Salt variability from Altimetry WOA 98 T/S Diagram Real-time T/P SSA T, S Variability Steric Height Anomaly profile Real-time Steric Height change WOA98 T,S Reynolds SST Adjusted Real-time T,S profile Preliminary Real-time SST Streic Height Anomaly Profile Heat and Salt storage
Temperature and Salinity profiles from altimetry WOCE I1 Section Observations Synthetic Temperature & Salinity derived from altimetry Difference between WOCE bservations and altimetry temperature and salinity TEMPERATURE SALINITY
Near real-time Temperature & Salinity profiles T WOCE I3 section 81.27°E, 20°S S
Conclusions • EOL parameter represents the thin, warmer and less saline near-surface stratified layer and contains the information of both the SST and SSS. • The relatively higher heat content within the higher EOL region would help in the deep-convection and affects the OLR. • The precipitation associated with the convection (OLR) lowers the SSS and affects the EOL. • Thus, the close linkage between EOL, OLR and SSS is useful for the estimation of SSS from the OLR through the EOL parameter in the oceanic regions of intense convection such as the tropical Indian Ocean and Equatorial Pacific Ocean.
Conclusions • This study provides algorithms through statistical relationships for obtaining the surface salinity in the tropical Oceans using OLR. • We expect the oceanographers’ community will benefit from the sea surface salinity derived from satellite observations of OLR, for the obvious importance of salinity in many studies related to upper ocean processes. • Whenever ocean models assimilate data and use to produce forecasts, it is important to investigate the impact of surface/subsurface salinity data on the forecast. • In some oceanic areas like northern Indian Ocean, particularly Bay of Bengal, salinity contributes greatly, besides temperature, for a relationship with density, and investigators identified the consequences that arise ignoring salinity information, especially on the upper ocean thermodynamics. • Salinity can have important consequences, especially on El Niño phenomena formation. • The growing tendency for obtaining the sea surface of the global oceans would, if measured accurately, boost the coupled model studies, ENSO forecast models as well as ocean global circulation models (OGCM) or regional scale circulation models and predicting the tropical cyclones.