Download
1 / 18
180 likes | 607 Views
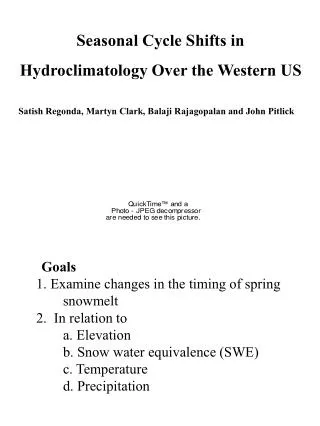
Seasonal shifts in hydroclimatology over the Western United States. Regonda, Rahagopalan, Clark, and Pitlick 2005. Journal of Climate, 18:372-384 Presented by ScienceWoman. Outline. Introduction Methods Results Conclusions. Introduction. A) Background

E N D
Seasonal shifts in hydroclimatology over the Western United States Regonda, Rahagopalan, Clark, and Pitlick 2005. Journal of Climate, 18:372-384 Presented by ScienceWoman
Outline • Introduction • Methods • Results • Conclusions
Introduction • A) Background • Increased land and ocean temperatures particularly over midlatitude regions • 0.5C in last 50 years (0.1C/decade) • Increased frequency of extreme weather events (floods, droughts, etc.) • Shifts in seasonal cycles – • early occurrence of spring • Early blossom of plants • lilac • Early spring flows • Increased vegetation cover • And extended growing period • B) Global trends and western U.S. hydroclimatology
Globel and wetern hydoclimatology* • “Recently a group of reseraecahres evaluatied futreu climate change impacts on western US water resources management as a part of the Accelerated Climate Prediction Invitivae (ACPI). The climate change scenarios of projected “business as usual” (BAU) greenhouse gas emmisssions were simulated using the National Center of Atmosphere Research (NCAR)/Departmetn of Energy (DOE) parallel climate model (PCM). The BAU scenarios exhibited an average warming of about 1-2C and both decrease and increase in precipitation across the western United States. Downscaling these scenarios to the Colorado river basin, Christensen et al. (2004) find a signficiant decrease in april SWE (-30%), annual runoff (-17%), total basin storage (-40%), and reservori leveells (-33%) by the end of the 21st century.” *of course the typos are mine!
methods • streamflow • hcdn database • various criteria = 89 stations • swe • nrcs april 1 • 469, 501, 239 • precipitation and temperature • nws coop • Julian day warm spell • regression anal. • streamflow, swe, precipitation, temperature
Figure 4 Figure 5 Figure 2 and 3
Scatterplots showing relationships between weather station elevation and trends in (a) warm day spells, (b) winter precipitation), © winter tempeature, (d) a map illustrating the spatial distribution of coop stations below 800 m (squares), between 800 and 2500 m (open circles), and above 2500 (filled circles). Note that there are very few COOP stations at high elevations. More ResultsFigure 7
Conclusions • Advancement in the timing of spring temperature spells over the western United States has resulted in the earlier occurrence of peak snowmelt flows in many mountain basins. • Changes in the timing of snowmelt are most evident in basins in the Pacific Northwest, which fall below 2500-m elevation. • Changes in the timing of snowmelt in high-elevation basins in the interior west are, for the most part, not statistically significant. • Increases in March and April streamflows and decreases in May and June streamflows at a number of sites suggest a broad shift in spring peak flow timing.
Conclusions (page 2) • Snowcourse measurements show a decreasing trend in the snow water equivalent (SWE) in April and May, which is also indicative of reduced snow and early melt. • Winter precipitation seems to be generally increasing, but there is no clear increase in spring streamflows. • This result suggests that in recent decades more of the precipitation is coming in the form of rain rather than snow.
Acknowledgements • I want to thank my dog for not chewing up more than one copy of my paper. • I want to thank my dear, sweet wonderful (and hot!) husband for making me coffee while I stayed up all nite working on this *%$#* assignment.
Thanks for listening!!!!!!!!!! • Questions? Science.woman@gmail.com