Download
1 / 37
370 likes | 724 Views
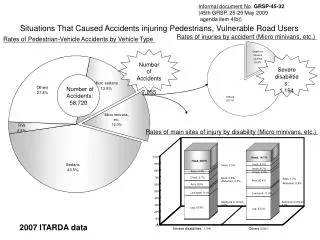
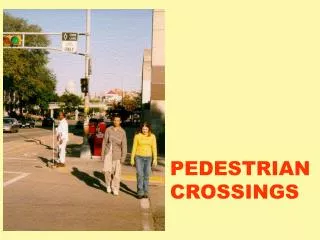
Child Pedestrian Accidents. The Effect of Interventions Over a 6 Year Period Thomas S. Renshaw, M.D. Professor of Orthopaedic Surgery Yale University. Pediatric trauma in the USA. Kills more children than all diseases combined Each year 22,000 deaths. Pedestrian accidents Drowning

E N D
Child Pedestrian Accidents The Effect of Interventions Over a 6 Year Period Thomas S. Renshaw, M.D. Professor of Orthopaedic Surgery Yale University
Pediatric trauma in the USA • Kills more children than all diseases combined • Each year 22,000 deaths
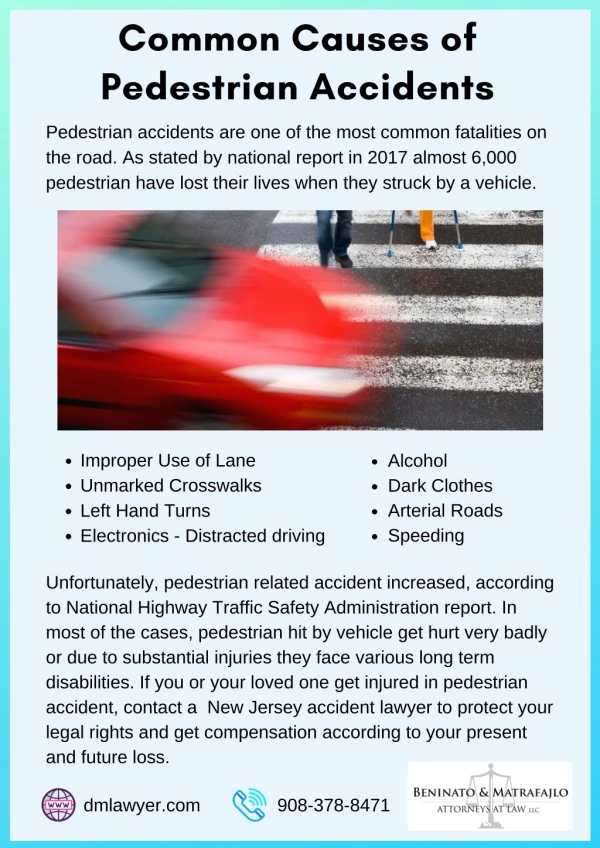
Pedestrian accidents Drowning Bicycle accidents Falls from heights Scald burns Flame burns Suicides Assaults Choking Smoke inhalation Ten Most Common Causes
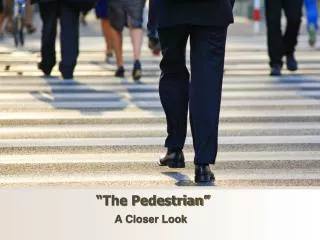
Why? Young Children: • Think that if they can see a driver, the driver can see them. • They think that cars can stop instantly
Young Children: • They can’t tell where sounds come from • They can’t judge how fast traffic is moving
Young Children: • They have a field of vision 1/3 that of adults • They don’t recognize danger or react to it • They think of cars as friendly, living creatures
Child Pedestrian Injuries • The 2nd leading cause of death in ages 5-9, behind cancer • Account for 30-50% of all trauma hospitalizations
Child Pedestrian Injuries • 18,000 annual hospital admissions • Fatality rate is 4%
Child pedestrian injuries in New Haven, CT have been reduced by 61% over a six year period.
From 223in 1992-93 To 87 in 1998-99
Data Collection New Haven, CT • Two 18 month periods • 1992-93 and 1998-99
Data Collection • Hospital records • School bus company information • City departments of: Police Traffic and Parking Planning Public Housing Economic Development School Districts
Collision Mapping • 26 census districts in New Haven • Each collision was mapped • Correlated with season of year, day of week, time of day • Correlated with demographics
Demographics • Population density • Race, gender, age • Income • Persons per household • Housing units per acre
Comparable for Both Periods Population Traffic volume up 3% Speed limits Right turn on red laws Parking status Public parks One-way streets Cross walks Walk signals Crossing guards
High Risk Factors Both Times • Non-white population • Households with >1 person per room • More children per acre
High Risk Factors Both Times • Occupied units per acre • Families below poverty line • Lower median incomes
Five Interventions Occurred • Educating the children • Increased school bussing • Educating the motorists • Decentralized public housing • Increased traffic tickets and warnings
Education for children • Traffic safety programs in all elementary school grades twice a year (from zero/year)
Increased school bussing • From 35% of children to 73% • More door to door pick-ups • Fewer streets to cross • 30-45 minutes on the bus = fewer daylight hours to play outside
Educating the Motorists • Public safe driving campaign • Flyers in public areas • Billboards • Mailings
Decentralized public housing • Largest complex demolished • Transfers to smaller projects • Vouchers for subsidized private housing • A nationwide trend to decrease crime and poverty
Increased traffic tickets and warnings by 22% • In high risk areas • At high risk times
Results 1992-93 223 injuries 1998-99 87 injuries a61%reduction
Other Intervention Options for High Risk Areas • Post crossing guards at high risk times
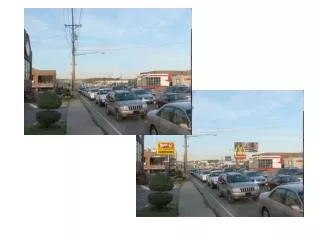
Other Intervention Options for High Risk Areas • Install highly visible warning signs for motorists
Other Intervention Options for High Risk Areas • Crosswalks should be well-lit and painted in bright colors • Bright yellow with zebra design • Embed rows of small lightsor reflectors in the asphalt • Install flashing signs over the middle of crosswalks • Self-flagging crosswalks Not like this
Other Intervention Options for High Risk Areas • Sidewalks added and fenced or barrier curbed
Other Intervention Options for High Risk Areas • Traffic lights reset to give children more time to cross busy intersections
Other Intervention Options for High Risk Areas • Playgrounds should be safe and clean
Other Intervention Options for High Risk Areas** • One-way streets • One side parking bans • Speed bumps
Other Intervention Options for High Risk Areas** • Pedestrian overpasses • Ban cell phone use by drivers** very difficult to accomplish politically
Child pedestrian injuries and deaths can be reduced without political battles and without changing the intractable problems of poverty and overpopulation.
“Never doubt that a small group of people can change the world, in fact it’s the only thing that ever has.” …… Margaret Mead
Thank you! Click here to return to Unit