Download
1 / 48
480 likes | 788 Views
Aviation safety within New Zealand was thought to be very high ... New Zealand was felt to have a lower rate of fatalities than most other countries, by ...

E N D
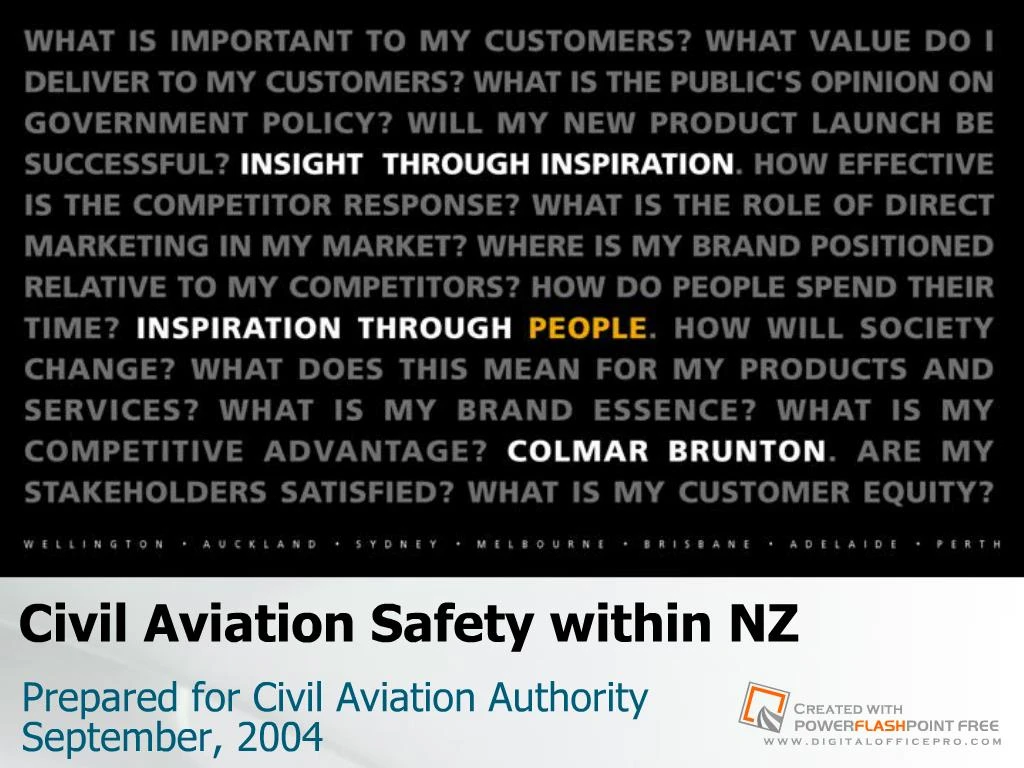
Slide 1:Civil Aviation Safety within NZ
Prepared for Civil Aviation Authority September, 2004
Slide 2:Agenda
Objectives Methodology General Perceptions of Aviation Safety Perceptions by Different User Groups Factors Influencing Air Safety in New Zealand Perceptions by Aircraft Type Monitoring Air Safety Conclusions
Slide 3:Objectives
The overall objective of the study was to gain an understanding of general perceptions of the level of aviation safety within New Zealand The specific research objectives were: What are the current perceptions of safety What are the expectations of safety What does �safe� mean What are the differences between safety and risk When is there an expectation of risk What constitutes aviation safety What are the safer modes of aviation travel What are the perceptions of safety measurements How does aviation safety compare to other modes of transport What are the general trends within air safety What are the different safety/risk levels from aviation between ground and air Who is most at risk from aviation
Slide 4:Methodology
A total of n=3 extended focus groups were conducted, and n=3 qualitative in-depth interviews: Auckland: n=1 group pilots and light aircraft owners Wellington: n=1 group general community travellers, n=1 group general community non-flyers Queenstown: n=3 qualitative in-depth interviews with aviation adventure and scenic flight users Groups and interviews were conducted between Monday 13th Sept � Thursday 16th Sept, 2004
Slide 5:General Perceptions Of Aviation Safety
Slide 6:General Perceptions of Safety
Aviation safety within New Zealand was thought to be very high Many talked of �dodgy� O/S airlines and that there are no �crazy people� here All perceived a risk associated with aviation It is not a natural thing to do to go up into the air Always potential for mechanical failure and human error Most accept that a �zero tolerance� level of accidents is unachievable Due to the naturally associated risks of flying And the specific and unique conditions of New Zealand There is a perception that levels of safety have been improving over time, and will continue to do so into the future Due to continually improved regulations and technology Due to continual learning from accidents
Slide 7:Risk of Different Modes of Travel
Plane Boat Car Most Safe Least Safe They can�t really be compared due to fundamental differences of mode of travel and ability of controller Non-flyer, general community, and adventurers took thought and consideration to decide on this ranking � they base their perceptions on news reports
Slide 8:Reasons for Level of Risk of Different Modes of Travel
Plane Boat Car Most Safe Least Safe High levels of regulation & monitoring High levels of training, maintenance & duty of care Constantly improving technology and standards Good weather monitoring & communications systems High personal involvement and sense of responsibility High technical expertise in construction & monitoring Low levels of regulation & monitoring Low levels of personal responsibility False sense of security of vehicles & poor/dangerous roads Higher levels of safety are strongly associated with perceptions of personal responsibility � flying is a privilege Perception of high crash control Perception of low crash control
Slide 9:Awareness of Aviation Safety
Pilots and Light Aircraft Owners Adventure & Scenic Flight Users Non-flyers High Awareness Low Awareness General Community Flyers Access to technical information & some reports
Slide 10:Professionals vs Amateurs
Low budget and small tour operators See the aviation industry as having two types of pilots, with commercial carriers being professional and personal owners as amateurs
Slide 11:International Comparisons
Comparing internationally, New Zealand was thought to have a high level of safety Although pilots stated that some of the highest risks of flying are experienced in New Zealand due to weather and geography Safety levels were generally attributed to appropriate levels of regulation, as well as the ability for New Zealand to appropriately fund the industry New Zealand was felt to have a lower rate of fatalities than most other countries, by percentage of flights and passengers It was acknowledged that flying is a major form of transport within New Zealand With a higher reliance than within other countries due to lack of other forms of transportation
Slide 12:Perceptions of Aviation Regulation
With the exception of pilots and light aircraft owners, most do not feel that New Zealand is too highly regulated The current standards of regulation are appropriate to the need for safety New Zealand has to protect its international reputation for tourism Pilots and light aircraft owners felt that regulation was becoming so high that it was causing safety issues Most tended to associate degrees of regulation with the number of people participating The more people, the higher the regulation Adventure and scenic flight users had extensive experience of paragliding/hang gliding and micro lights O/S They felt that the regulation was not as high as O/S � but the level of personal responsibility was significantly higher New Zealand was considered less bureaucratic, but still managed to stop cowboys Had less people participating, therefore having less risk
Slide 13:Changes Over Time
Changes in time were primarily associated with terrorism The implications of 9/11 had a filter down effect on safety standards There is a perception that aviation safety is getting better all the time As a result of increased regulation and monitoring, as well as improvements in technology There is however a feeling that the lower end of aviation is becoming less safe due to accessibility and regulation not keeping up Additionally there is a perception that with accessibility is a lack of personal responsibility due to lack of knowledge of risks Pilots felt there had been a degradation of weather reporting Shifting to instruments rather than people Additionally reporting of timing of weather was thought to be too early
Slide 14:Perceptions By Different User Groups
Slide 15:Perceptions of Pilots & Light Aircraft Owners
Very high levels of knowledge and involvement within flying All had been flying for long periods of time Felt that aviation safety within NZ was very high Although there were areas for improvement Areas of most concern were: Deregistration of pilots due to new medical requirements Overall lowering of experience of pilots Lack of instrument ratings & focus on map reading Weather reporting inadequacies Too changeable and not appropriately reported Lack of training of pilots to deal with weather Especially fuel monitoring Problems with location reporting Fear of CAA
Slide 16:Perceptions of Adventure & Scenic Flight Users
Generally engaging in a range of adventure aviation activities Domestically and internationally, & over long periods of time Often have partial flight licences, or have done some personal flying in the past Acknowledge risk of their behaviour, and generally have high personal responsibility But feel overall aviation is safe Want to see increased regulation in their area Feel that it is becoming too open/accessible, and that safety standards are dropping Strong concerns with weather related safety, and difficulty of using instruments in areas around Queenstown
Slide 17:General Community Travellers
Perceptions are primarily via aircraft safety through experience and media coverage Have exposure to lots of different flights and aircraft within NZ and internationally Many of these people are very well travelled There is also a high exposure to media coverage of accident here and O/S Well travelled people attached little risk to larger passenger flights And an increasing level of risk to the smaller the plane an/or the type of activity the plane is engaged in Their concerns are mostly about terrorism, physical comfort, safety (thrombosis) and maintenance (bits falling off planes)
Slide 18:Non-flyers
Have high anxiety about aircraft safety in the air There is little perceived risk of on-ground injury or fatality They have heightened awareness of what could go wrong through media coverage And the physical sensation of flying (noise, rattles etc) also heightens their anxiety They are somewhat reassured that New Zealand is likely to be well regulated and monitored and that large carriers will self monitor to protect their reputation They are accepting of accidents incurred by those that take risks Safety or lack of it becomes the responsibility of the risk taker) They are less accepting of accidents that are unexpected or avoidable
Slide 19:Factors Influencing Air Safety In NZ
Slide 20:Factors Influencing High Safety Levels
Contributing to high levels of safety within New Zealand are: Regulation at all levels compared to O/S Incident reporting, compliance standards, inspections & enforcement High levels of pilot training and experience Pilot experience in dealing with extremely difficult weather and geographical conditions Learning from mistakes and accidents High levels of engineering and maintenance Constant monitoring of pilots Economic environment enabling safety standards � not a 3rd world country Regulation of corridors Less people flying than O/S High levels of maintenance Impact of terrorism prevention measures
Slide 21:Negative Factors on Safety
Main reasons attributed to aviation accidents within New Zealand were: Fuel monitoring � over regulation of technology Risk taking behaviour- cowboys & lack of experience Lack of pilot experience � inability to deal with unforeseen circumstances Lack of experience within the aviation industry � consequence of medicals Policeman role of CAA � consequences of fear Lack of detailed reports for learning Weather monitoring and reporting system Fear of Air Traffic control Accessibility of flying and lack of regulation at lower end (micro light, gliders etc) Physical age of plane Lack of maintenance Position reporting (use of Maori names)
Slide 22:Opportunities for Safety Improvement
Areas identified to increase levels of safety within New Zealand were: Central weather web-site via aero clubs More broken down accident reports � type of incident by plane type Facilitation of more pilots to get IFR accredited Wider availability of fuel monitoring equipment Tightening of micro light flying regulation Greater adherence to �Climb, Confess, Comply� approach Introduction of a �One Fuel� card Shift of role of CAA to advisor rather than policeman More detailed incident reports for learning
Slide 23:Perceptions by Aircraft Type
Slide 24:Perceptions of Air Safety Risk
Highest levels of risk associated with small personally owned and flown aircraft: Not sound aircraft for NZ conditions Lack of maintenance on aircraft Lack of pilot experience � more amateurs/farmers Higher risk was associated with different activities But there was general acknowledgement that when an individual engages in high risk activities it is overall their responsibility It is interesting to note that most were not concerned with aviation safety issues on the ground
Slide 25:Risk of Different Modes of Aviation Travel
Larger & Medium Jet & Turboprop Most Safe Least Safe Small Piston Engine Helicopters Parachute, Hang Gliders & Paragliders Very Small Aircraft Expected Safety Personal Risk Larger planes were generally seen as safer due to both ability to deal with weather & financial resources available Balloons
Slide 26:Larger & Medium Jet & Turboprop Aircraft
These aircraft were perceived as having high levels of safety and low levels of risk The size and power of the aircraft were the main reasons for this, but also identified were: Significant resource allocation Significant regulation Experienced pilots and crew (on-board and ground) Application of new technology High levels of self regulation by carriers Duty of care
Slide 27:Small Piston Engine Aircraft
These were generally assumed as being smaller commercial aircraft Again they were thought to have high levels of safety Primarily due to regulation and aircraft power Also identified as influencing safety levels were: Carrier responsibility � same as applied to larger aircraft Pilot experience Duty of care � pilot and carrier There was some concern about the standards of lower budget and smaller tour operators Primarily due to potential for human error and maintenance issues
Slide 28:Balloons
Balloons were not naturally associated with the aviation industry for most There was significant confusion about the overall safety of balloons But upon consideration they were assumed to be fairly safe compared to some other forms of aviation transport No incidents could be recalled This safety was primarily associated with: Carrier responsibility � fear of safety and reputation of carrier No engine � less chance for mechanical problems No industry cowboys � not likely to engage in risk taking behaviour
Slide 29:Helicopters
Initially little safety concern was associated with helicopters But upon consideration they were thought to be very high risk Incidents were recalled This was compounded further upon seeing incident statistics There was some previous perception that incident rates had decreased Pilots and light aircraft owners felt they were comparatively unsafe Lack of safety was mainly associated with pilot behaviour: More industry cowboys The weather and geographical conditions in which they fly were also thought to be more dangerous
Slide 30:Parachute, Hang Gliders & Paragliders
Parachuting, hang gliding and paragliding were all considered high risk activities There was perceived to be a high chance of accident and injury, but low chance of fatality No engine therefore less chance of mechanical failure A strong level of personal risk and responsibility was attributed to those who undertake these activities This area was felt to hold the greatest risk in the future due to: Increased accessibility of the activities and aircraft (paragliders) Lack of appropriate regulation and monitoring of standards and piloting
Slide 31:Very Small Aircraft
These were primarily perceived as low budget and smaller tour operators, as well as privately owned single engine aircraft Seen as the most unsafe due to: Inability to deal with New Zealand weather conditions Lower levels of regulation and monitoring Lower pilot experience and flying frequency Lack of financial resources and cost cutting activities Cowboy behaviour Lack of appropriate technology Lack of duty of care
Slide 32:Monitoring Air Safety
Slide 33:Importance of Measurement of Safety
All felt that the measurement of safety is extremely important Specifically to gain learnings for regulations and monitoring There was a strong perception that measurement of safety is an important part of improving overall safety and learning for the future Unresolved incidents lead to larger accidents It is a preventative role It was also considered imperative for the reputation of the aviation industry within New Zealand Especially given how much of the tourism industry is based around aviation in NZ Reporting of safety becomes increasingly important and more people fly and the potential for incidents becomes higher
Slide 34:Acceptibility Of Current Accident Rates
Current perceived accident rates are considered as acceptable as possible Given the type of aircraft and the level of inherent risk in some activities Perceived accident rates (within an acceptable range): Small aircraft � one per month Small commercial � 3-4 per year Larger carrier � one every 10-20 years People believe we should have an attitude of nil tolerance for accidents But in reality (given the nature of NZ terrain, weather, and use of aircraft) it is unrealistic to expect zero accidents People were not able to identify a percentage figure for an aviation safety target
Slide 35:Overall Response to Figures
Respondents were shown a range of graphs and statistics, discussing: Perceptions of the figures The appropriateness of the reporting style and format Most were very surprised at helicopter and motorbike figures compared to other modes Except amongst pilots and light aircraft owners Most assumed that these figures were not representative of the actual risk and incident rate Most questioned the relevance of these figure comparisons given their personal aviation behaviour
Slide 36:Measurement Format Perceptions
There was considerable confusion as to how to read and interpret the figures shown Most felt that they were not an adequate or appropriate representation of the figures Measurement by kilometres travelled was not considered an appropriate indicator Especially when comparing different modes of travel � it was not considered appropriate to compare the different modes of transport due to inherent risk, safety, regulation, training and percentage of people travelling issues There was significant discussion that planes fly more kilometres, and were therefore skewing the results within the graphs
Slide 37:Preferred Safety Measurement Indicators
All struggled to know how to measure safety and aviation incidents Most thought naturally in terms of numbers of fatalities � but understood a more sensitive measure was required Additionally they struggled to know what was an appropriate measure International comparisons were considered most appropriate � an indicator of where we need to be on a global scale and what improvements we need to make Those options for measurement identified were: Raw figures � by fatality and incident Trend measures Broken down by aircraft type/type of accident Comparisons to international credit ratings By volume of flights
Slide 38:Pie Chart Depictions
Figures presented are consistent with views that private flights or very small aircraft have a higher risk of fatality Concern with figures/format presented: Too simplistic and misleading � passenger transport is the largest portion of the chart but doesn�t account for volume of passengers, number of flights or type of use compared to others Replication of results between small and very small aircraft Figures don�t add up to 100% What is the average based on? Number of years? Pie chart depictions are considered too simplistic and potentially misleading
Slide 39:Mode of Travel Comparisons
People are most concerned about the safety record of the aircraft they are most likely to travel on More important to see figures and comparisons for large and small commercial aircraft They are less concerned with helicopter safety The comparisons are not considered valid Travel as a passenger by aircraft is vastly different to travel by car in terms of responsibility and control Graph comparisons with road safety are considered meaningless
Slide 40:Kilometres Travelled Measure
The distance (and associated wear and tear) travelled by aircraft is to a different scale to the distance travelled by car So comparisons are not seen as being �apples with apples� The graph was also seen as deliberately downplaying the risk of flying by large aircraft by comparing it to motorbike accidents It also does not reflect the scale of loss of life if a fatal accident does occur This measure is only considered to have relevance between aircraft Kilometres travelled is considered a misleading or irrelevant measure
Slide 41:Ideal Figure Comparisons
Want to see figures/graphs that track air safety (by type of aircraft) over time This shows meaningful indicators of improvements in aviation safety Shows whether air safety is stable or tracking up or down Only when both domestic and international trends are established can safety targets be set After what level of improvement required is established A benchmark, figures tracked over time, and international comparisons with other aircraft are most meaningful
Slide 42:Ideal Measurement Figure Presentation
Ideal measurement of air safety would identify type of aircraft (closely aligned with use), type of incident/accident, and track changes
Slide 43:Development of a Percentage Target Figure
The general community are unable to make an informed decision on what is an acceptable accident rate Or what the target should and could be Without the benefit of a benchmark, historical trends or international comparisons people are guessing in a �vacuum� And can�t make an informed assessment about what is an acceptable level of accidents or set a realistic safety target
Slide 44:Conclusions
Slide 45:Conclusions
Planes overall are seen as the safest mode of transport within New Zealand Primarily due to regulations and the personal responsibility of pilots Flying is seen to be as safe as it can be NZ is well regulated, and fatal accidents are at an acceptable level given the perceived risk Zero accidents is not a feasible target (although ideal) There are always going to be mechanical failures and human error When you engage in risk taking activities, it is YOUR responsibility Safety standards are believed to be increasing all the time Due to increases in technology and learnings from accidents Some areas of concern for safety were identified, specifically Small piston engine aircraft Paragliding
Slide 46:Conclusions
These security issues were associated with a lack of regulation and pilot competence This concern was expected to grow into the future There was a desire to see this become a focus for safety by the CAA Several areas were identified as a priority to further increase levels of safety into the future: Central weather web-site via aero clubs More broken down accident reports � type of incident by plane type Facilitation of more pilots to get IFR accredited Wider availability of fuel monitoring equipment Tightening of micro light flying regulation Greater adherence to �Climb, Confess, Comply� approach Introduction of a �One Fuel� card Shift of role of CAA to advisor rather than policeman More detailed incident reports for learning
Slide 47:Conclusions
Most struggled with the concept of both: How to report safety figures What the safety target ought to be Comparisons with road travel have little meaning for the general community Annual figures presented in isolation of historical trends lack context The most meaningful comparisons are those which are both over time, and NZ vs O/S They are the only figures that allow measurement of improvement to be made Safety targets can only realistically be established in line with this knowledge