1 / 58
660 likes | 1.43k Views
** Python Training for Data Science: https://www.edureka.co/python ** <br>This Edureka Machine Learning tutorial (Machine Learning Tutorial with Python Blog: https://goo.gl/fe7ykh ) series presents another video on "K-Means Clustering Algorithm". Within the video you will learn the concepts of K-Means clustering and its implementation using python. Below are the topics covered in today's session: <br><br>1. What is Clustering? <br>2. Types of Clustering <br>3. What is K-Means Clustering? <br>4. How does a K-Means Algorithm works? <br>5. K-Means Clustering Using Python <br><br>Machine Learning Tutorial Playlist: https://goo.gl/UxjTxm

E N D
Copyright © 2017, edureka and/or its affiliates. All rights reserved.
Agenda of Today’s Session ▪ What is Clustering? ▪ Types of Clustering ▪ What is K- Means Clustering? ▪ How does a K-Means Algorithm works? ▪ K-Means with Python Copyright © 2018, edureka and/or its affiliates. All rights reserved. Copyright © 2017, edureka and/or its affiliates. All rights reserved.
What is Clustering? Copyright © 2018, edureka and/or its affiliates. All rights reserved.
“Clustering is the process of dividing the datasets What is Clustering? into groups, consisting of similar data-points” ▪ Points in the same group are as similar as possible ▪ Points in different group are as dissimilar as possible
Group of diners in a restaurant What is Clustering? Items arranged in a mall
Where is it Used? Recommendation System Recommended Movies Fickr’s Photos
Retail Store How business use Clustering? Banking Insurance Companies
Exclusive Clustering ▪ Hard Clustering Types of Clustering ▪ Data Point / Item belongs exclusively to one cluster ▪ For Example: K-Means Clustering Exclusive Clustering Overlapping Clustering Hierarchical Clustering
Overlapping Clustering ▪ Soft Cluster Types of Clustering ▪ Data Point/ Item belongs to multiple cluster ▪ For Example: Fuzzy/ C-Means Clustering Exclusive Clustering Overlapping Clustering Hierarchical Clustering
Hierarchical Clustering Types of Clustering Exclusive Clustering Overlapping Clustering 1 2 3 4 Hierarchical Clustering
“K-Means is a clustering algorithm whose mail goal is to group similar elements or data points into a What is K-Means Clustering? cluster.” NOTE: ‘K’ in K-Means represent the number of clusters
What is K-Means Clustering? Pile of dirty clothes
https://gifer.com/en/Ckp3 Where Can I apply K-Means? Document Classifier
K-Means Algorithm Number of Clusters = 3
Number of Clusters, K = 3 K-Means Algorithm
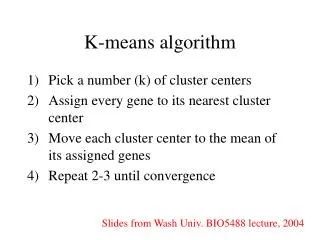
▪ Step 1: Select the number of clusters to be identified, i.e select a value for K =3 in this case ▪ Step 2: Randomly select 3 distinct data point ▪ Step 3: Measure the distance between the 1stpoint K-Means Algorithm and selected 3 clusters Distance from point 1 to the red cluster the blue cluster the green cluster Distance from point 1 to Distance from point 1 to
K-Means Algorithm Step 4: Assign the 1st point to nearest cluster (red in this case).
K-Means Algorithm Step 5: Calculate the mean value including the new point for the red cluster
Find to which cluster does point 2 belongs to, how? ▪ Repeat the same procedure but measure the K-Means Algorithm distance to the red mean Add the point to the nearest cluster Distance from point 2 to the red cluster the blue cluster the green cluster Distance from point 2 to Distance from point 2 to
K-Means Algorithm Calculate the cluster mean including the new point
Find to which cluster does point 3 belongs to, how? ▪ Repeat the same procedure but measure the K-Means Algorithm distance to the red mean
K-Means Algorithm Measure the distance and add the 3rdpoint to the nearest cluster, (red)
K-Means Algorithm Calculate the new cluster mean using the new point
▪ Measure the distance ▪ Assign the point to the nearest cluster ▪ Calculate the cluster mean using the new point K-Means Algorithm To which cluster does this point belongs to?
▪ Measure the distance ▪ Assign the point to the nearest cluster ▪ Calculate the cluster mean using the new point K-Means Algorithm
▪ Measure the distance ▪ Assign the point to the nearest cluster ▪ Calculate the cluster mean using the new point K-Means Algorithm
▪ Measure the distance from the cluster mean (centroids) ▪ Assign the point to the nearest cluster ▪ Calculate the cluster mean using the new point K-Means Algorithm To which cluster does this point belongs to?
▪ Measure the distance from the cluster mean (centroids) ▪ Assign the point to the nearest cluster ▪ Calculate the cluster mean using the new point K-Means Algorithm Since the point is located closet to green cluster
▪ Measure the distance from the cluster mean (centroids) ▪ Assign the point to the nearest cluster ▪ Calculate the cluster mean using the new point K-Means Algorithm
K-Means Algorithm Since all of these points are located closet to green cluster so all of them will be assigned to green cluster
K-Means Algorithm Result from 1st iteration Original/Expected Result
K-Means Algorithm Total variation within the cluster According to the K-Means Algorithm it iterates over again and again unless and until the data points within each cluster stops changing
Iteration 2: Again we will start from the beginning. But this time we will be selecting different initial random point (as compared to what we chose in the 1stiteration) K-Means Algorithm ▪ Step 1: Select the number of clusters to be identified, i.e. K =3 in this case ▪ Step 2: Randomly select 3 distinct data point ▪ Step 3: Measure the distance between the 1stpoint and selected 3 clusters
Algorithm picks 3 initial clusters and adds the remaining points to the cluster with the nearest mean, and again recalculating the mean each time a new point is added to the cluster K-Means Algorithm
Algorithm picks 3 initial clusters and adds the remaining points to the cluster with the nearest mean, and again recalculating the mean each time a new point is added to the cluster K-Means Algorithm
Algorithm picks 3 initial clusters and adds the remaining points to the cluster with the nearest mean, and again recalculating the mean each time a new point is added to the cluster K-Means Algorithm
Algorithm picks 3 initial clusters and adds the remaining points to the cluster with the nearest mean, and again recalculating the mean each time a new point is added to the cluster K-Means Algorithm Total variation within the cluster
Iteration 3: Again we will start from the beginning and select different initial random point (as compared to what we chose in the 1st and 2nditeration) K-Means Algorithm Pick 3 initial clusters
K-Means Algorithm Cluster the remaining points
Finally sum the variation within each cluster K-Means Algorithm Total variation within the cluster
The algorithm can now compare the result and select the best variance out of it K-Means Algorithm 1stIteration 2ndIteration 3rdIteration
Now what if we have our data plotted on the X and Y axis K-Means Algorithm Y-Axis X-Axis
Similarly, pick initial 3 random points.. K-Means Algorithm Y-Axis X-Axis
We will be using the Euclidean distance (in 2D its same as that of a Pythagorean Theorem) K-Means Algorithm ℎ2= ?2+ ?2 p b Y-Axis X-Axis
Again assign the point to the nearest cluster K-Means Algorithm Y-Axis X-Axis
Finally calculate the centroid (mean of cluster) including the new point K-Means Algorithm Y-Axis X-Axis
Finally in first iteration you get something like this…again you have to iterate this process to get the final cluster K-Means Algorithm Y-Axis X-Axis
In the previous scenario k value was known to be 3, but this is not always true How will you find K value
For deciding the value of k, you have to use hit and trail method, starting from K = 1 How will you find K value K=1 is the worst case scenario, even you cross- verify it with total variation
Now try with K = 2 How will you find K value K=2 is still better then K = 1 (Total Variation) K = 1 K = 2