Download
1 / 18
260 likes | 483 Views
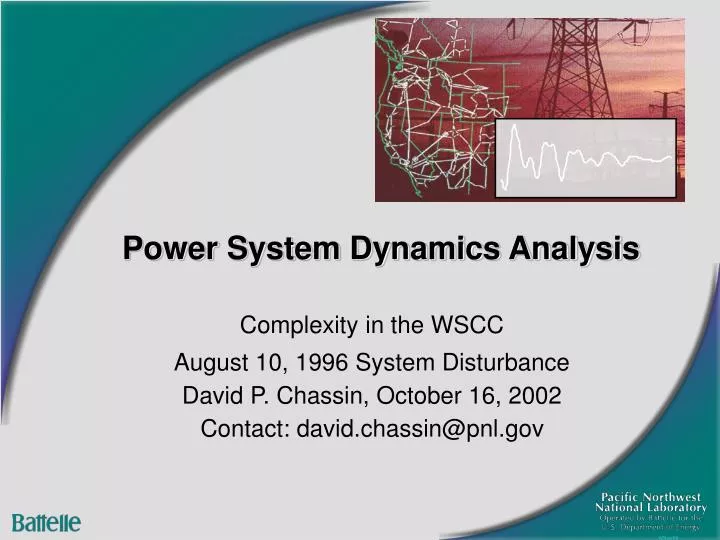
Power System Dynamics Analysis. Complexity in the WSCC August 10, 1996 System Disturbance David P. Chassin, October 16, 2002 Contact: david.chassin@pnl.gov. 6Nov98. August 1996 West Coast Blackout Summary of Events. WSCC 8-10-96 15:48 PAST major disturbance

E N D
Power System Dynamics Analysis Complexity in the WSCC August 10, 1996 System Disturbance David P. Chassin, October 16, 2002 Contact: david.chassin@pnl.gov 6Nov98
August 1996 West Coast Blackout Summary of Events • WSCC 8-10-96 15:48 PAST major disturbance • 4 islands, 7.5M customers out up to 9 hours • Initiating event: 500 kV Keeler-Allston flashover to trees • Trip cause: poor right-of-way maintenance • Numerous supporting events • Follow-up events • COI limit lowered to 3200 MW (Aug 11) • Account for limits at McNary (exciter) and The Dalles (fish) • Raised Aug 12-14 to 3600 MW to avoid blackouts in CA 2
PNNL and Power Systems • DOE Transmission Reliability Program • Real-Time Grid Reliability Management • Reliability and Markets, Load as a Resource • Distributed Energy Resources Integration • Infrastructure Assurance Outreach Program • Utility vulnerability assessments • Interaction with NERC, others on security topics • Interest in SCADA security • Energy System Transformation Initiative • Integrated econophysics modeling and simulation • Next generation power technology development 3
Disturbances Unobserved response System planning Power System operation System Automatic control Observed response Measurement Based Information System Decision Processes Information Wide-Area Measurement SystemDynamic monitor network supports advanced analysis “Better information supports better - and faster - decisions.” 4
Real-Time System DataCollected from various monitors throughout the grid Bonneville Power Administration Phasor Data Concentrator 5
Power System Measurement ToolsTools for managing data & signal analysis 6
“Ringdown” Analysis ToolAdvanced dynamic analysis Extracting a linear model from measured data • Dynamic analysis • Model validation • Control design 7
Advanced Dynamic System Analysis and Model Validation August 10, 1996 post-disturbance analysis Determine if model calibration is needed. Currently working with western utilities to improve power grid models 8
Power System Econophysics PJM 1999 Load/Price Probability Distributions Q = Qmax (11/P2)4.54 Abstract Transactive Machine 9
Four Corners Unit 5 Tripped with 710 MW on May 8, 2002 At 13:38 PDT With GFA: Frequency Excursion Arrests at 59.950 Hz within 0.7 sec. Frequency (Hz) Without GFA: Frequency Drops to 59.886 Hz within 5.8 sec. Seconds (from 13:38:20 PDT) Grid-Friendly Appliance Controller Grid Friendly™ Appliances Grid-friendly appliances… …rapid, automatic response to grid crises …platform for active communication & control …pre-heat/pre-cool to coast through peaks …utilize & value thermal storage …increase reliability & security …unnoticeable by consumer …mass customization/marketing 106 =100 Loads and Reserves on a Typical U.S. Peak Day Residential (non-GFA) 10% Industrial 28% Residential (GFA) 20% GFA potential exceeds US operating reserve requirements! Operating reserves 13% Commercial 29% “…given enough ants, you can move a mountain!...” impromptu reaction from a utility power engineer 10
Overview of WSCC August 10, 1996 15:48 PAST Disturbance Based on WSCC Disturbance Report Approved by WSCC Operations Committee on October 18, 1996
High northwest transmission loading • High imports to CA • Heavy imports from Canada and Idaho • COI at 4750 MW • Similar to conditions prior to 7/2/96 disturbance • Warning signs visible • Previous high-load issues • Small power/large voltage swings • Suggested voltage support problems in NW 12
Equipment out of service • Lines • 500 kV: Big Eddy-Ostrander, John Day-Marion, and Marion-Lane (reactive support around Portland) flashover to trees • 115 kV: Allston-Rainer degraded hdwr, Longview-Lexington cable installation. • Breakers • 500 kV: Marion, Keeler (modifications) • Transformers • 500/230 kV: Keeler (modification) • Static VAR Comp (SVC) • Keeler reduced support to500 kV (tied to 230 kV side) x x x 13
Triggering Events • 15:42:37 Keller-Allston • Sags into trees, flashes, trips • Overload par-lines hold 5 min • McNary react-power at max • 15:47:29 St. Johns-Merwin • Lines trip on relay malfunc. • KA par-line loads increase • 15:47:36 Ross-Lexington • Tree flashover and trip • 207 MW from Swift lost • System voltage sags • 15:47:36 McNary • Units trip, exciter problem • System power/voltage osc. begins • ID-UT-CO-AZ-NM-NV Surge • COI power flows down east side • Out-of-step trips • CA-AZ remain tied together ! ! ! ! ! 14
Final Result • 28,000 MW of under-frequency load shedding • 20,000 MW of undesired generation loss • Four major islands • Northern California (North of LA to Oregon border) • Losses: 11,600 MW load; 7,900 MW generation • Frequency excursions: 58.54 – 60.7 – 58.3, restored in 2.5 hrs. • Southern California (SoCal, NV, AZ, NM, El Paso, Baja) • Losses: 15 820 MW load; 13,500 MW generation • Frequency excursions: 61.3 – 58.5, restored in 70 min. • Northern (BC, OR, WA, MT, WY, ID) • Losses: 2,100 MW load; 5,700 MW generation • Frequency excursions: 60.4, restored in 7 minutes • Alberta • Losses: 970 MW load; 146 MW generation • Frequency excursions: 60.4 – 59.0, restored in 6 minutes 15
Open Questions re. Complexity • Report only identifies the incontrovertible points and fails to address more controversial questions: • Why was line maintenance inadequate? • Why was system operated in single-contingency mode? • Why did AZ-CA separation scheme fail to operate? • Why did models fail to predict oscillations? • Why did system damping fail? • Lesson for us: • Don’t go just by the official reports. Much more is not reported or discussed because of sensitivities. The social dynamics of a tightly knit community factors into what is knowable. We have to look deeper. 16
Problems Persist 480 MW generation dropped 2900 MW generation tripped 1400 MW Chief Joe brake inserted ~350 MW load loss ~86 MW UFLS 17