Download
1 / 21
210 likes | 591 Views
By; Paul Kazyak and Hunter Hines Draw-A-Man Test Born-August 6, 1886 1921- Lewis Terman and Stanford University 1924- Minneapolis Minnesota 1925- Measurement of Intelligence by Drawings “Draw A Man Test” Never married Forced to retire early Died-April 4, 1959 Binet Goddard Terman

E N D
By; Paul Kazyak and Hunter Hines Draw-A-Man Test
Born-August 6, 1886 • 1921- Lewis Terman and Stanford University • 1924- Minneapolis Minnesota • 1925- Measurement of Intelligence by Drawings • “Draw A Man Test” • Never married • Forced to retire early • Died-April 4, 1959
Binet Goddard Terman Goodenough
“To the young child, drawing is more akin to talking to himself than to talking to others. It is a way of dramatizing his ideas through making them visible.” • “In this sense it (drawing) is a language” • “A child doesn’t care whether the picture is beautiful or not, but he wants to tell what he has in mind.” • “Details do not trouble him”
“At the age of 5, approximately 35 % of children’s drawings of the human figure include the hat, but only 13 % show the hair” At the age of 8 the %’s increase to 72 % for the hat and 45% for the hair. Baldness though is still more common than hatlessness
W.T. Hanes • Single classroom • 3 tables with 4 chairs at each • 3rd- 5th grade • Mixed group of Special Education and Regular • 10 kids per group • 3 stations per table/ 1 table had 4 • Kids were brought to us
Concept Development Intellectual Development Intellectual Maturity Mental Age Raw Score Standard Score Visual Realism Realism Descriptive Symbolism Two Dimensional Drawing Three Dimensional Drawing Key Terms
Diagnosis of Behavior Disorders Drawings by Sensory Deviates Levels of Artistic Talent Sex Differences Relation to Other Test of Intelligence Study of Personality in Drawings Theory In Depth
Hypothesis • The content of a child’s drawing shows a solid indication of their intellectual development. Using Goodenough’s scale will indicate the level of intellectual development. When comparing several groups of drawings, we believe that the children diagnosed with learning disabilities will score equally on Goodenough’s Scale to those seen as normal in regards to learning abilities. While children of average learning abilities will seem to have a much more proportional drawing, they will fall short of the detail in which the handicapped children will include in their drawings.
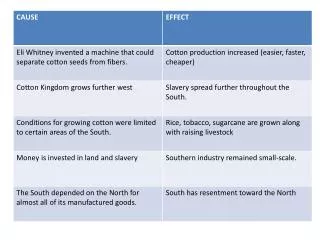
Analysis of Data • What DOES THIS ALL MEAN? Most common errors Overall: 8,12,13,15,21,27,29,34,38*,49,52,58,65,70,71 Most common errors for Regular: 8,12,13,15,21,29,38,52,58,65 Most common errors for special: 2,5,8,9*,10,13,17,21,22,23,25,31,32,34,45,48*, 49,57,58,59,70*
Results • Based on our hypothesis that the special education would score as well as the regular children, we were incorrect almost entirely. The special education children not only fell short with the overall scoring but specifically when it came to the specific details of the drawings • While our hypothesis was wrong the special education children were still considered in one of the highest levels of intellectual maturity as defined by Goodenough.
Less children in the room Separate special and regular Get to know the children Before administering the test Finding out the specific diagnosis of special children Much larger group of test subjects Finding group of artistically inclined children Evaluation