Download
1 / 23
240 likes | 1.24k Views
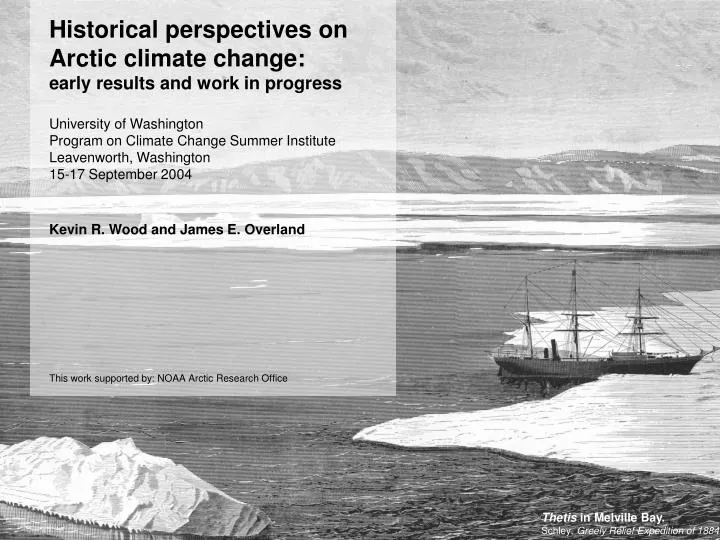
Historical perspectives on Arctic climate change: early results and work in progress University of Washington Program on Climate Change Summer Institute Leavenworth, Washington 15-17 September 2004 Kevin R. Wood and James E. Overland This work supported by: NOAA Arctic Research Office.

E N D
Historical perspectives on Arctic climate change: early results and work in progress University of Washington Program on Climate Change Summer Institute Leavenworth, Washington 15-17 September 2004 Kevin R. Wood and James E. Overland This work supported by: NOAA Arctic Research Office Thetis in Melville Bay. Schley, Greely Relief Expedition of 1884.
Aims of historical climate research Devon Island summer air temperature proxy • Corroborate proxy-derived climate history with observed surface conditions. • Understand how observed surface conditions relate to climate and environmental change over longer timescales. • Aid interpretation of historical and traditional knowledge in the modern context of climate and environmental change and variability. Red indicates +1 SD; Dark Blue indicates -1 SD compared to the reference period (1901-1960) Fisher and Koerner 1990; Overpeck 1998 Ice core record derived from melt layer stratigraphy Erk-sing-ra: source of local knowledge recorded by Capt. Maguire at Point Barrow in the 1850s. “[We] had worse seasons before the Ship came...” Journal of Rochefort Maguire. Photo: US National Archives.
Early results and work in progress • Arctic climate and the search for the Northwest Passage, 1818-1910. • Climate lessons from the First International Polar Year, 1881-1884. • Some thoughts on the comparison of historical observations with modern records. Winter Quarters, 1853 Instrument shelter, 1868 Journal, Pt. Barrow, 1852 IPY meteorological station, 1882 Melt anomaly, 1938
19th c. historical data resources Arctic America EXAMPLES of source material: Parry 1821, Journal of a Voyage for the Discovery of a North-west Passage. Maguire 1852, unpublished meterological journal of HMS Plover (manuscript courtesy Nat’l Library of Ireland). Plus: seasonal transition, freshwater ice, biological and social phenologies ● Monthly Mean Temperature ● Onset of Melt/Freeze ● Summer Ice Conditions ● Annual Ice Thickness
Barrow Strait, August 1853 National Archives of Canada Accession Number 1989-399-3 M’Clure Strait, August 1851 National Archives of Canada Accession Number 1989-398-4 Barrow Strait, August 1853 National Archives of Canada Accession Number 1989-399-4 Arctic climate and the search for the Northwest Passage, 1818-1910 We expected to find indications of a large-magnitude climate shift consistent with ‘Little Ice Age’ conditions: • Thicker, more widespread and persistent sea ice. • Colder air temperatures. • Changes in melt season (later onset of melt, earlier freeze).
Discovery Bay, August 1883 Greely, Three Years of Arctic Service M’Clure Strait, August 1908 Bernier, Cruise of the Arctic Wellington Channel, August 1853 Savours, The search for the Northwest Passage Arctic climate and the search for the Northwest Passage, 1818-1910 Instead we found: • Scant evidence of an extreme LIA climate. • Explorers encountered generally typical conditions compared to present climatology. • The Northwest Passage was discovered and effectively mapped by 1859; that it was not navigated was due to technology not climate.
Early 19th century discovery expeditions compared to sea ice climatology (1971 – 2000) Arctic Ocean Greenland Banks I Victoria I Baffin Island Climatic sea ice distribution based on percent frequency of presence on September 10, 1971-2000 (Canadian Ice Service 2002). Many ship tracks & other direct observations are not inconsistent with recent sea ice climatology
First-year sea ice thickness measurements are within modern variability 18 Ice Thickness Measurements 1820 - 1876 Year & Expedition Thickness (cm) 1820 Parry 1825 Parry 1830 Ross 1831 Ross 1849 J.C.Ross 1851 Penny 1851 Austin 1851 M’Clure 1852 Collinson 1852 M’Clure 1853 Collinson 1853 M’Clure 1853 Kellet 1854 Collinson 1854 Kellet 1854 Rae 1859 M’Clintock 1876 Nares 201 228 218 205 +213 +218 198 231 Typical Modern Maximum 215 210 188 213 244 228 171 183 250 215 Blue indicates >1 Std. Dev. over reference mean. Cross-hatching indicates an interrupted measurement series. (Reference data: Environment Canada and Canadian Ice Service 2002).
30 melt transition dates (1820-1906) estimated from daily mean SAT Std Dev Historical and Modern Stations Melt Transition Date 19th c. stations shown in red, 20th c. in black Contours = ref. mean onset of melt (5 day int.) Frequency ± reference mean 1971-2000 (Ref. data: Global Daily Climatology Network) Onset of melt observed by 19th c. explorers is not inconsistent with modern values. Evidence of change in the melt season
Examples of an early thaw: First-hand accounts from the HMS Sophia and the USS Polaris HMS Sophia, June 1851:“About the end of May and the first week of June the weather changed in a remarkable manner. On the 7th…water was observed on the land.” Sutherland, Journal of a Voyage in Baffin’s Bay and Barrow Straits… Melt Transition: June 3 -1° C (+1 Std Dev) USS Polaris, June 3, 1872:“The plain is full of fine streamlets of water that give moisture to the ground. Saxifragas are blooming, and are distributed all over the plain…” Buddington journal, quoted in Narrative of the North Polar Expedition Melt Transition: May 31 -1° C Transition date estimates are consistent with physical descriptions. (+2.3 Std Dev)
Evidence of change in the onset of freeze 34 freeze transition dates (1819-1905) estimated from daily mean SAT Std Dev Freeze Transition Date Historical and Modern Stations 19th c. stations shown in red, 20th c. in black Contours = ref. mean onset of melt (5 day int.) Frequency ± reference mean 1971-2000 (Ref. data: Global Daily Climatology Network) Onset of freeze is frequently consistent with modern values.
An early freeze: HMS Hecla and Fury, August 1824 August, 1824: “The month of August was remarkable, as much for the quantity of fog, rain and snow which fell, as for the extraordinary low temperature of the atmosphere.” Parry, Journal of a third voyage… Freeze Transition: Aug. 11 -1° C (-3.6 Std Dev) Mean transition date: Sept. 9 Median freeze-up date: Sept. 24 September 13-16: “For three days we were…sallying from morning to night with all hands, and with the watch at night, two boats constantly under the bows…” Parry, Journal of a third voyage… Image PU6103 courtesy of the National Maritime Museum, Greenwich
A late freeze: HMS Hecla and Griper, September 1819 September 7, 1819: “The ‘young’ or ‘bay’ ice formed during the night in all the sheltered places about the floe…to the thickness of three-quarters of an inch; and the pools upon the floe were now almost entirely solid…” Parry, Journal of a Voyage for the Discovery of a North-west Passage Freeze Transition: Sept. 7 -1° C SST SAT (+1 Std Dev) Mean transition date: Aug. 30 Median freeze-up date: Sept. 10 September 24-26: “The whole length of this canal was…nearly two miles and one-third, and the average thickness of the ice was seven inches.”Parry, Journal of a Voyage…
Climate lessons from the First International Polar Year, 1881-1884 • A marked pattern of regional SAT variability is evident and is associated with observed changes in the environment. • A longer perspective shows that Arctic environmental change is not a problem unique to the last 30 years, nor to the past century. • Environmental changes observed since the 1950s may also be explained by sensitivity to lower amplitude century-scale trends. Sgt. Jewell recording temperature, Fort Conger (Ca. 1881-1883). Paleocrystic ice, N. Ellesmere Island. British Arctic Expedition, 1875-76. Photo: Smithsonian Anthropological Archives
12 Primary Stations 3 Secondary Stations Related Observations IPY-1: the first pan-Arctic scientific enterprise, 1881-1884 1. Cape Thordsen 15. Jan Mayen 2. Bossekop 14. Godthaab 6 7 16 5 4 3 2 1 4. Sodankylä 15 11. Kingua Fjord 8 10 14 11 9 5. Maliye Karmakuly 10. Fort Conger 12 13 Note: All but 4 IPY stations were in areas with Native populations 6. Kara Sea 7. Sagastyr Not Pictured 3. Kautokeino 12. Fort Chimo 13. Nain 16. Arhangl’sk 8. Point Barrow 9. Fort Rae
Melt season arrives early in Finnmark and in Baffin Bay An early freeze in the Kara Sea, White Sea, and in Spitzbergen. Dutch expedition fails to reach Dikson Island. But melt is late at the Lena Delta and Jan Mayen Seasonal transition during IPY-1, 1882-1883 Melt and freeze anomaly Departure from 1968-1997 Means Days +/- Mean 15 10 5 0 -5 -10 -15 Days +/- Mean 15 10 5 0 -5 -10 -15 † † Freeze Anomaly 1882 Melt Anomaly 1883 Regional differences in the onset of melt and freeze are apparent. † Reference mean series contains only 6 years (1996-2001)
“By the last of June the tundra was nearly free from snow…the few hardy flowers were in bloom…” Report of Pt. Barrow Exp. “Winter came on rapidly; the lagoon, near the station, was closed entirely on [Sept.] 26th…” Report of Pt. Barrow Exp. June 4, 1853. “Another beautiful summers day, the thaw is going on in good earnest…we watch its progress [as one] would do in seeing his prison clear away.” Journal of Rochefort Maguire Phenological calendar: seasonal transition at Point Barrow Daylight Sun Angle + Indicators First Birds Melt Onset Snow Disappears Freeze Onset Lagoons Freeze + + + + + + + + + + + + 2000 1995 1990 1985 1980 1975 1970 + + + + + + + + + + + + + + + + + + + IPY-1 + 1881 1882 1883 (+) Maguire (HMS Plover) + 1852 1853 1854 + (+) 9/16 6/1 6/13 Data sources: US Naval Observatory, Astronomical Applications. NOAA NCDC. R. Stone, NOAA CMDL (Snowmelt). P. Ray, Report of the Point Barrow Exp. R. Maguire, Journal
IPY-1 "In recent years it has been noticed that the southern permafrost boundary is steadily retreating northward. Thus, in 1837 at the city of Mezen' wells had to be dug through permafrost. In 1933 you had to go 40 miles north to discover traces of permafrost. This retreat of the permafrost is due to a general change in the climate and in particular the general re-warming of the Arctic…” N.N. Zubov, Arctic Ice and the Warming of the Arctic, from'In the Center of the Arctic, 1948. Onset of melt based on air temperature (instrumental) Rivers ice-free (observed) (70% explained by onset date) “We had worse seasons before…” Erk-sing-ra Date Discontinuity of observations IPY-1 in the context of 2 ½ centuries of change Onset of Melt in Northern Russia, 1734-1998 “[It is] a matter in my judgement of greater importance to the prosperity of this country if, as I conceive it to be the case the frosty springs and chilly summers we have been subject to for many years past, so much so that it is now 16 or 17 years since we had a full crop of apples for cyder, are caused by the increase of Ice which seems to have accumulated for many years past.”J. Banks to W. Scoresby 22 Sept. 1817 (Whitby Museum Archive). Krakatoa (August 1883) Dalton Solar Minimum Data Sources: E. Wahlén, III Supplementband zum Repertorium für Meteorologie, 1887. M. Rykatschew, II Supplementband zum Repertorium für Meteorologie, 1887. NOAA National Climate Data Center GDCN, 2002. V. Vuglinsky. Russian River Ice Thickness and Duration, NSIDC, 2000.
Patterns in the spring break-up of Russian rivers Ice-free Date Anomaly Pattern and long-term trend reinforced by Tornionjoki river record. Anomaly, 5 year average (10 day offset) Angara river appears to have an opposite trend, but does reflect stronger anomalies. Dalton Solar Minimum Year Data Sources: M. Rykatschew, II Supplementband zum Repertorium für Meteorologie, 1887. V. Vuglinsky. Russian River Ice Thickness and Duration, NSIDC, 2000. B. Benson, B. and J. Magnuson,Global Lake and River Ice Phenology Database, NSIDC, 2000.
Krakatoa effect?“Remarkable” differences in meteorology reported by IPY observersat Sodankylä : • Great differences in barometric pressure and air temperature. • Much more precipitation; double the number of days with rain or snow. Monthly Mean Temp (C) Compared to 1968-97 1882-83 1883-84 “It seems highly probable that 1882-83 was much closer to the normal climate. The inhabitants also noticed these exceptional circumstances.” Lemström and Biese, Observations fait aux stations de Sodankylä et de Kultala, 1882-83 et 1883-84. Sep Oct Nov Dec Jan Feb Mar Apr May Jun Jul Aug Difference in Precipitation (mm) 1882-83 and 1883-84 Sodankylä IPY station, 1882-84 Eduard Munch, The Scream
Mapping 20th century climate parameters necessary for historical comparison The complete seasonal transition histories of 105 Arctic communities In the context of the 20th century. Regional and local patterns of variability and change Change: regime-like, inter-decadal, linear The IPY in the continuum of time Movie of 20th century • Onset of melt • Onset of freeze • Summer duration • 3 Year trailing averages • First differences Animations Observed associations • Pan-Arctic warmth with +AO • Changing regional patterns • Correlated with physical environment 1st difference of freeze onset
Persistent melt season anomalies and sea-ice distribution in the 1930s AO -0.03 AO -0.24 AO 0.45 Diminished sea-ice cover in the Barents and Kara Seas is associated with an increase in the warm melt season anomaly observed in this region. Warm and cold anomalies are also associated with sea ice in Chukotka. Warm anomaly precedes +AO? Atlas der Vereisungsverhältnisse. Oberkommando der Kriegsmarine, 1942
Paleocrystic ice, N. Ellesmere Island. British Arctic Expedition, 1875-76. Photo: Smithsonian Anthropological Archives [The] warming of the Arctic is not a phenomenon limited to the single area of the Polar regions; it is on a scale affecting the whole terrestrial globe.N. N. Zubov, 1948. From: Arctic Ice and the Warming of the Arctic (translated from The Center of the Arctic).