Download
1 / 5
0 likes | 15 Views
A Fluke power quality analyzer is a sophisticated instrument used to monitor and analyze the quality of electrical power in a system. It measures various parameters such as voltage, current, frequency, harmonics, and power fluctuations to identify issues like voltage sags, swells, transients, harmonics distortion, and power factor imbalance. These analyzers provide detailed data and insights into the performance of electrical systems, helping engineers and technicians troubleshoot problems, optimize energy efficiency, and ensure equipment reliability.

E N D
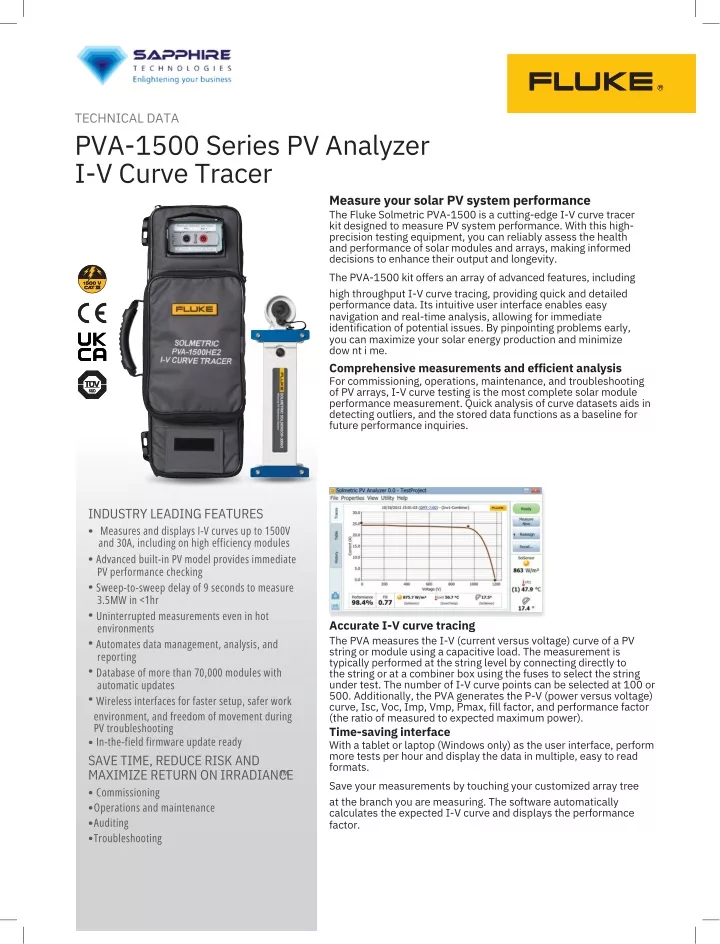
TECHNICAL DATA PVA-1500 Series PV Analyzer I-V Curve Tracer Measure your solar PV system performance The Fluke Solmetric PVA-1500 is a cutting-edge I-V curve tracer kit designed to measure PV system performance. With this high- precision testing equipment, you can reliably assess the health and performance of solar modules and arrays, making informed decisions to enhance their output and longevity. The PVA-1500 kit offers an array of advanced features, including high throughput I-V curve tracing, providing quick and detailed performance data. Its intuitive user interface enables easy navigation and real-time analysis, allowing for immediate identification of potential issues. By pinpointing problems early, you can maximize your solar energy production and minimize dow nt i me. Comprehensive measurements and efficient analysis For commissioning, operations, maintenance, and troubleshooting of PV arrays, I-V curve testing is the most complete solar module performance measurement. Quick analysis of curve datasets aids in detecting outliers, and the stored data functions as a baseline for future performance inquiries. INDUSTRY LEADING FEATURES Measures and displays I-V curves up to 1500V and 30A, including on high efficiency modules Advanced built-in PV model provides immediate PV performance checking Sweep-to-sweep delay of 9 seconds to measure 3.5MW in <1hr Uninterrupted measurements even in hot environments Automates data management, analysis, and reporting Database of more than 70,000 modules with automatic updates Wireless interfaces for faster setup, safer work environment, and freedom of movement during PV troubleshooting In-the-field firmware update ready • • • • Accurate I-V curve tracing The PVA measures the I-V (current versus voltage) curve of a PV string or module using a capacitive load. The measurement is typically performed at the string level by connecting directly to the string or at a combiner box using the fuses to select the string under test. The number of I-V curve points can be selected at 100 or 500. Additionally, the PVA generates the P-V (power versus voltage) curve, Isc, Voc, Imp, Vmp, Pmax, fill factor, and performance factor (the ratio of measured to expected maximum power). Time-saving interface With a tablet or laptop (Windows only) as the user interface, perform more tests per hour and display the data in multiple, easy to read formats. Save your measurements by touching your customized array tree at the branch you are measuring. The software automatically calculates the expected I-V curve and displays the performance factor. • • • • SAVE TIME, REDUCE RISK AND MAXIMIZE RETURN ON IRRADIANCE Commissioning Operations and maintenance Auditing Troubleshooting • ™ • • •
The Fluke Solmetric PVA-1500HE2 Elevates PV Testing Capabilities Accurate measurement of high efficiency modules up to 30A Highly efficient modules (>19% module efficiency) possess high capacitance, posing a challenge for some I-V curve tracers that may not be able to measure them. The PVA-1500HE2 is uniquely designed to measure all string types, even those with high efficiency modules, up to 30A. Rapid performance in high temperature environments The PVA-1500HE2 operates with a swift sweep-to-sweep delay of 9 seconds (at Voc<1350V). This results in the ability to measure 3.5 MW within an hour, even in high-temperature settings where standard curve tracers often fail due to overheating. SolSensor™ Wireless PV Reference Sensor The SolSensor™ provides irradiance, module temperature, and array tilt data to the PV model. The model uses this information to predict the I-V curve shape at these operating conditions and to translate the measured curve to standard test conditions. The SolSensor™ clamps to the module frame, automatically orienting the irradiance sensor to the plane-of-array. Irradiance and temperature accuracy The spectral response of the silicon photodiode sensor in the SolSensor™ is corrected for the PV technology under test. Special factors are provided for multi- and mono-crystalline cells as well as cadmium telluride (CdTe) and other thin film technologies. The sensor is temperature compensated and the angular response of each unit is calibrated for rotation and elevation. As a result, the SolSensor™ is accurate over a broad range of technologies, sky conditions, and sun angles, allowing I-V curve measurements earlier and later in the day. The SolSensor™ provides two external thermocouple inputs for measuring module backside temperatures. Effective cell temperature can also be calculated directly from the measured I-V curve per IEC 60904-5. The PVA’s SmartTemp™ feature, optionally, blends these two methods for best accuracy. Wireless connectivity Wireless interface between user’s tablet or laptop (Windows), PVA unit, and SolSensor™. The PVA and SolSensor™ communicate wirelessly with your PC via WiFi with a line-of-sight wireless range of 100m. That means no wires underfoot, quick setup, the ability to move around while troubleshooting strings, and flexibility to measure multiple combiner boxes with a single SolSensor™ setup. 2 Fluke Corporation PVA-1500 Series PV Analyzer I-V Curve Tracer
Turn PVA data into key insights, visualizations, and customizable reports Capture data in the field with the PVA Application and validate the results with the Data Analysis Tool (DAT), a Microsoft Excel™-based solution streamlining the analysis of PVA I-V curve data. It presents analysis results in multiple formats. It compiles key PV param- eters in a string table, flags non-conforming strings, and delivers a statistical overview of the entire array. Additionally, it visually combines string I-V curves at the combiner box level, offering a clear depiction of consistency and identifying atypical strings. The tool also generates histograms for PV parameters across the string population, and this data can be added to a customizable report exported as a PDF. The Data Analysis Tool (DAT) can be down- loaded for free use with any PVA. Supported languages: English, French, Spanish, German, Italian, Traditional Chinese, Simplified Chinese, and Brazilian Portuguese. Note: The PVA Application and the Data Analysis Tool work best with Microsoft Windows 10 or Windows 11. Training Fluke offers a variety of training related to PV test and measurement. Training can either be delivered as a virtual on-demand course or as a live online presentation/discussion format with a product expert (may differ regionally). PVA Operator Training PVA Specialist Training PV Troubleshooting Training Take this training if: you will be conducting I-V curve measurements in the field using the PVA. • Introduction to I-V Curve Tracing and the PVA • Preparing for I-V Curve Measurements • Measuring I-V Curves in the Field • Measuring Irradiance and Temperature • Signs of Abnormal PV String Performance • Exporting Your Measurement Data Take this training if: you will be analyzing PVA data. Key topics: Take this training if: you will be troubleshooting PV array operation and performance. Key topics: • Introduction to I-V Curve Tracing and the PVA How the PVA Predicts the Expected I-V Curve Setting Up the PVA Software Managing Measurement Data as it Accumulates Reviewing Measurement Results in the Data Analysis Tool Identifying I-V Curve Deviations and Determining Likely Causes Generating and Managing a Punch List Acceptance Testing Following Repairs Generating a Final Report • Special Electrical Behaviors of PV cells, Modules, and Bypass Diodes Troubleshooting the 6 Classes of Deviation from Ideal I-V Curve Shape Troubleshooting Strategies for PV Strings and Harnessed Strings Using Infrared Imaging in Combi- nation with I-V Curve Tracing Acceptance Testing Following Repa i r s • • • • • • • • • • • • 3 Fluke Corporation PVA-1500 Series PV Analyzer I-V Curve Tracer
Specifications PVA-1500T2 PVA-1500HE2 20 to 1500V DC ±(0.5% + 0.25V) ±(0.5% + 0.04A) Voltage Range (Voc) Voltage Accuracy Current Accuracy Power Accuracy I-V Trace Points I-V Sweep Duration Operating (ambient) Safety and Regulatory ±(1.7% + 1.0W) (current ≥3A, module efficiency <19%) 100 or 500 (selectable) 0.05 to 2 seconds (typically 0.2 seconds for PV strings) 0 to 45 °C (32 to 113 °F) CAT III 1500V, CE, UKCA, TUV Temperature Maximum Current (Isc) Module Efficiency <19% Module Efficiency ≥19% Measurement Throughput Sweep-to-sweep delay (@VOC ≤ 1350V) Max number of I-V sweeps per hour (@VOC ≤ 1350V) Max megawatts measured per hour 30A DC 10A DC 30A DC <9 seconds 400 sweeps/hr 3.5 MW/hr Thermal Capacity - Number of I-V sweeps before the PVA must cool down 25 °C (77 °F) Ambient, 9 or 18 second sweep-to-sweep delay 45 °C (113 °F) Ambient, 18 second sweep-to-sweep delay 45 °C (113 °F) Ambient, 9 second sweep-to-sweep delay Unlimited 550 330 SolSensor™ Irradiance Accuracy ±2 % when used to predict the performance of well characterized poly- and monocrystalline PV modules with direct irradiance >600W/m2. Contact Fluke for more information on accurate irradiance measurements. ±2 ºC (not including limits of error of thermocouple) ±2° typical (0 to 45°) Typically, 3.5 s 100 m (open line of sight) Cell Accuracy Tilt Accuracy Update Interval Wireless Range Temperature 4 Fluke Corporation PVA-1500 Series PV Analyzer I-V Curve Tracer
PVA-1500 Kits Clamp and Multimeter Kit • Insulation, Clamp and Multimeter Kit • Insulation Testing 2500V Kit • Thermography Kit • • Solmetric PVA-1500HE2 Fluke TiS75+ Fluke 393 FC • • • • • Fluke 87V Fluke 1587 FC Fluke 1537 • Ordering information FLUKE-PVA-1500T2 PV Analyzer I-V Curve Tracer FLUKE-PVA-1500HE2 High Efficiency PV Analyzer I-V Curve Tracer FLUKE-SOL-Ti-9Hz-KIT High Efficiency PV Analyzer I-V Curve Tracer Thermography Kit FLUKE-SOL-INS87-KIT High Efficiency PV Analyzer I-V Curve Tracer Insulation Testing, Mul- timeter and Clamp Meter Kit FLUKE-SOL-INS37-KIT High Efficiency PV Analyzer I-V Curve Tracer Insulation Testing Kit 2500V FLUKE-PVA-1500T2/TR PV Analyzer I-V Curve Tracer Single Seat On-Demand Training Kit FLUKE-PVA-1500HE2/TR High Efficiency PV Analyzer I-V Curve Tracer Single Seat On-Demand Training Kit FLUKE-SOL-DMM87V-KIT High Efficiency PV Analyzer I-V Curve Tracer Multimeter and Clamp Meter Kit Fluke. Keeping your world up and running.® Included in PVA kit PVA unit, SolSensor™ and clamp, Windows application, alligator test leads, MC4 disconnect tool, chargers, Data Analysis Tool (DAT), 2x thermocouples and adhesive disks, sensor cleaning supplies Optional accessories Transit case (included with the PVA-1500HE2), field charging kit, training FLUKE TECHNOLOGIES PVT. LTD. Toll Free: 1800 419 3001 Email: info.india@fluke.com www.fluke.com/india w.facebook.com/flukeindia Web: w w 5 Fluke Corporation PVA-1500 Series PV Analyzer I-V Curve Tracer