1 / 38

Chapter 19 cover

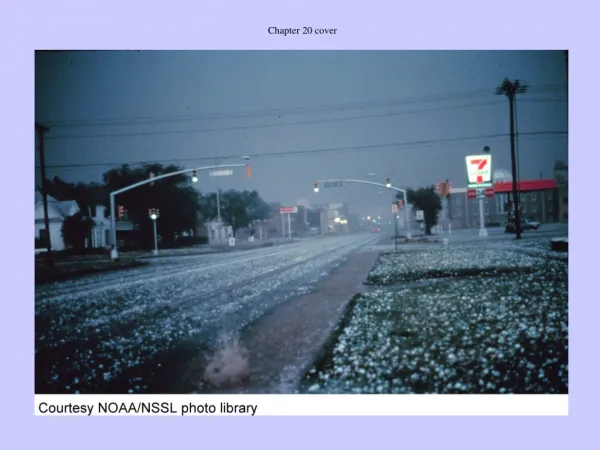
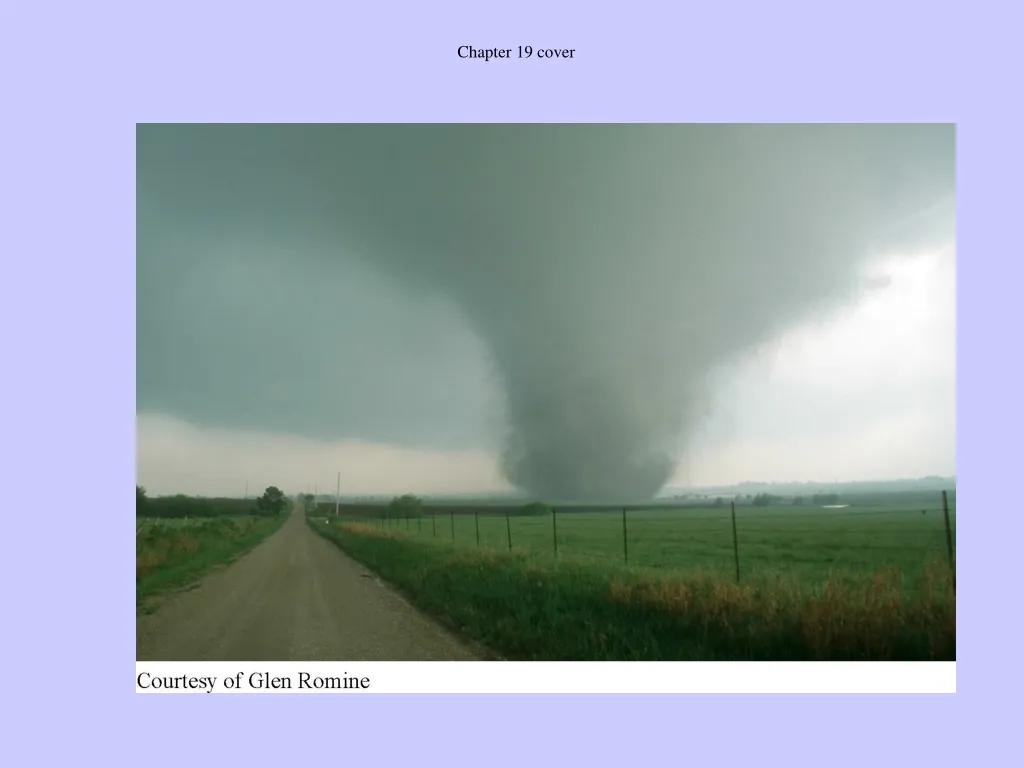
Chapter 19 cover. Figure 19.1. Figure 19.2. Figure 19.3. Figure 19.4. Figure 19.5. Figure 19.6. Figure 19.7. Figure 19.8. Figure 19.9. Figure 19.10. Figure 19.11. Figure 19.12. Figure 19.13. Figure 19.14. Figure 19.15. Figure 19.16. Figure 19.17. Figure 19.18. Figure 19.19.

Jimmy
Download Presentation

Chapter 19 cover

An Image/Link below is provided (as is) to download presentation Download Policy: Content on the Website is provided to you AS IS for your information and personal use and may not be sold / licensed / shared on other websites without getting consent from its author. Content is provided to you AS IS for your information and personal use only. Download presentation by click this link. While downloading, if for some reason you are not able to download a presentation, the publisher may have deleted the file from their server. During download, if you can't get a presentation, the file might be deleted by the publisher.

E N D

Presentation Transcript


  1. Chapter 19 cover

  2. Figure 19.1

  3. Figure 19.2

  4. Figure 19.3

  5. Figure 19.4

  6. Figure 19.5

  7. Figure 19.6

  8. Figure 19.7

  9. Figure 19.8

  10. Figure 19.9

  11. Figure 19.10

  12. Figure 19.11

  13. Figure 19.12

  14. Figure 19.13

  15. Figure 19.14

  16. Figure 19.15

  17. Figure 19.16

  18. Figure 19.17

  19. Figure 19.18

  20. Figure 19.19

  21. Figure 19.20

  22. Figure 19.21

  23. Figure 19.22

  24. Figure 19 A

  25. Figure 19 B

  26. Figure 19 C

  27. Figure 19 D

  28. Figure 19 E

  29. Figure 19 F

  30. Figure 19 G

  31. Figure 19 H

  32. Figure 19 I

  33. Figure 19 J

  34. Figure 19 K

  35. Table 19.1 EF-Scale Wind Speed Ranges and corresponding wind speeds from the Fujita scale

  36. Table 19.2 Table 19.2 Damage Indicators for establishing EF-Scale ratings For the structures listed below, damage assessors use detailed tables that describe the degree of damage, together with example photographs from damaged structures to establish the likely wind speed and EF scale rating for a tornado

  37. Table 19.3 Estimating the EF scale rating from damage to a one or two family residence (Indicator 2 in Table 19.2)

  38. Table 19.4 TABLE 19.2: Indices Used to Forecast Tornado Potential CAPE: Convective Available Potential Energy (Joules/Kilogram) 0  500 Very weak instability 500  1500 Weak Instability 1500  2500 Moderate Instability 2500  4000 Strong Instability > 4000 Extreme Instability SRH: Storm Relative Helicity (meters2 / seconds2) 0 150 Weak Shear 150  300 Moderate Shear 300  500 Strong Shear > 500 Extreme Shear EHI: Energy Helicity Index 0  2 Tornadoes unlikely 2  4 Tornadoes possible >4 Significant tornado threat

More Related