Download
1 / 8
80 likes | 682 Views
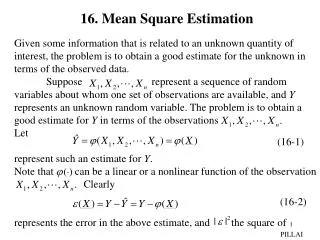
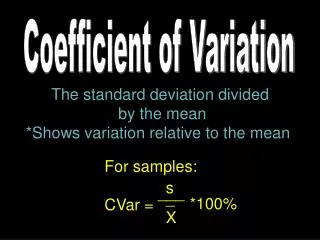
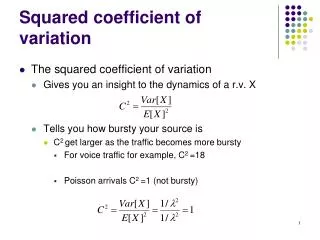
Relationship between mean yield, coefficient of variation, mean square error and plot size in wheat field experiments Coefficient of variation: Relative measure of variation = (standard deviation/mean)*100 = (s/x)*100 = (square root of the variance/mean)*100 = s 2 /x MSE = s 2

E N D
Relationship between mean yield, coefficient of variation, mean square error and plot size in wheat field experiments • Coefficient of variation: • Relative measure of variation • = (standard deviation/mean)*100 = (s/x)*100 • = (square root of the variance/mean)*100 = s2/x • MSE = s2 • Index of the reliability of the experiment (Gomez & Gomez) • Used to describe the amount of variation in a population (Cochran) • Used to evaluate results from different experiments involving the same units of measure (Steel et al)
MATERIALS and METHODS 362 Wheat field experiments 200 Fertilizer, weed management and tillage 142 Variety Trials Information Collected from each Trial:RepsNumber of treatmentsPlot sizeCVDegrees of freedom (error term)MSEMean YieldSED
Plot Size: 16’ x 30’ or 4.88 x .9.1m = 44m2 Fertilizer/Weed/Tillage Plot Size: 4’ x 4’ = 1.48m2 Variety Trials
Fertilizer, Weed, and/or Tillage Experiments Mean Min Max Std. Dev # of replications 3.83 2.00 6.00 0.77 # of treatments 11.1 4.00 49.0 8.10 Mean yield (kg/ha) 2802 379 5915 1222 MSE (kg2/ha2) 113782 8256 480822 97743 CV, % 13.3 3.09 61.8 7.51 Plot size, m2 37.2 8.4 96.0 24.3 Standard error (kg/ha) 231 64.2 558 98.7
Variety Trials Mean Min Max Std. Dev # of replications 3.34 2.00 6.00 0.92 # of treatments 14.8 4.00 60.0 11.7 Mean yield (kg/ha) 2841 967 5196 924 MSE (kg2/ha2) 140179 40576 342290 78607 CV, % 13.7 5.17 30.9 5.29 Plot size, m2 3.49 0.31 19.1 3.13 Standard error (kg/ha) 290 138 532 107
y = 49.92 + 0.02x r 2 = 0.084 y = 11.68 - 0.0014x+ 12135( / ) r = 0.42 1 2 x 500 70 60 400 50 300 40 CV, % MSE x 1000 30 200 20 100 10 0 0 0 1000 2000 3000 4000 5000 6000 0 1000 2000 3000 4000 5000 6000 Mean yield, kg ha Mean yield, kg ha -1 -1 y = 9.66 + 0.03x r 2 = 0.16 y = 115.03 - 0.01x r = 0.01 2 70 500 60 400 50 300 40 CV, % MSE x 1000 30 200 20 100 10 0 0 0 100 200 300 400 500 0 20 40 60 80 100 MSE x 1000 Plot size, m 2 FIGURE 1. Relationship between mean yield, mean square error (MSE), coefficient of variation (CV) and plot size from 220 fertilizer, weed management and tillage trials.
y = 11.35 - 0.0014x + 16934( / ) r = 0.44 1 2 y = 94.29 + 0.01x r = 0.0081 2 x 400 35 30 300 25 20 CV, % MSE x 1000 200 15 10 100 5 0 0 0 1000 2000 3000 4000 5000 6000 0 1000 2000 3000 4000 5000 6000 Mean yield, kg ha -1 Mean yield, kg ha -1 y = 6.91 + 0.04x r 2 = 0.43 y = 130.93 - 4.25x r = 0.019 2 35 400 30 300 25 20 CV, % MSE x 1000 200 15 10 100 5 0 0 0 50 100 150 200 250 300 350 0 5 10 15 20 MSE x 1000 Plot size, m 2 FIGURE 2. Relationship between mean yield, mean square error (MSE), coefficient of variation (CV) and plot size from 142 variety trials.
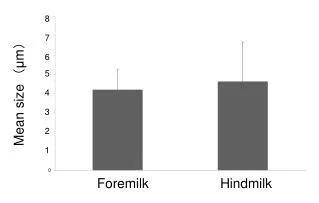
CV useful for comparing the experimental variation of trials containing variables with common units • Smaller plot sizes employed in plant breeding trials (average of 3.59m2) compared to fertilizer/weed/tillage trials (average of 37.2m2) reduced the variability encountered in the estimation of the mean. • Smaller plot size employed in the variety trials is considered to be advantageous in field plot work since it is consistent with the resolution where detectable differences in soil test parameters exist and that should be treated independently • Replication • Randomization