Download
1 / 56
560 likes | 970 Views
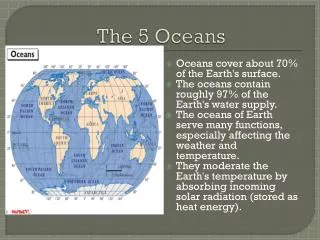
Module 8: The Evolving Earth Cassini probe at Titan Activity 2: Remote Sensing TOPEX/Poseidon satellite Summary In this Activity we will investigate: (a) what is meant by remote sensing; and (b) remote sensing using different wavelengths and applications of remote sensing.

E N D
Module 8: The Evolving Earth Cassini probe at Titan Activity 2:Remote Sensing TOPEX/Poseidon satellite
Summary • In this Activity we will investigate: • (a) what is meant by remote sensing; and • (b) remote sensing using different wavelengths and applications of remote sensing.
Colour (left) and infrared images of the volcano Pele and a lava ring around it on Io, taken using the Galileo probe spectrometer. • In this Unit we study many images of surface details on our Earth and also on other planets. Most of these cannot be obtained using telescopes on, or orbiting, Earth. For example, existing technology does not allow us to see this high resolution detail on Jupiter’s natural satellite Io from Earth:
We have not sent people to take photographs as they fly past Venus or Mars or Saturn. And if we wanted to know (for example) the number of pine trees in Tasmania, we would find it easier to calculate the number of trees shown in an aerial photograph than sending someone to count trees one by one. Such images and data can be obtained by means of REMOTE SENSING techniques applied from aeroplanes, artificial satellites and probes to the planets.
TOPEX-POSEIDON SATELLITE (a) What is Remote Sensing? • REMOTE SENSING is described as a process by means of which information is obtained about an object which is separated from a sensor. • Strictly speaking, an Earth based telescope, or even the human eye, can be defined as remote sensing instruments. In the context of this Activity however, remote sensing is mainly concerned with the derivation of data about the surface or atmosphere of a planet using an elevated platform - - such as a satellite.
Development of Remote Sensing The first successful attempts to take aerial photographs were made by a Frenchman, Felicien Tournachon, known as Nadar, in 1858. Using a hot air balloon Nadar took photographs of Petit-Clamart, a suburb of Paris. The first aerial reconnaissance photos are believed to have been taken from Union tethered balloons during the American Civil War. In the following years, American J. Gairmann designed a camera for aerial photography. Late in the nineteenth century and early in the twentieth, cameras were mounted on manned and unmanned balloons, kites, rockets and - in Munich - even strapped to homing pigeons!
Near Rome, in 1908, a photograph was taken from an aeroplane for the first time by the pioneer of powered flight Wilbur Wright. This lead to the development of cameras and even aircraft designed specifically for remote sensing. The 1957 launch of Sputnik-1, the first artificial satellite, was to revolutionize remote sensing. Sending a camera in orbit means positioning it in an unrivalled vantage point. In 1963 astronaut Gordon Cooper, in orbit on a Mercury capsule, reported seeing roads and buildings clearly. Photographs were taken by astronauts in subsequent manned missions.
Landsat 4 • In 1972, Landsat 1 was launched by NASA for the United States Geological Survey. Travelling in North-South orbits at an altitude of around 917km, Landsat 1 was used for carrying out land and ocean surveys. It was followed by other Landsat satellites, right up to Landsat 7 in use today. Other Earth-observing satellite systems followed the first Landsats. Some of these are dedicated to specific tasks, such as the Seastar satellite designed for monitoring water quality, in particular chlorophyll levels.
GALILEO VOYAGER CASSINI • And already in 1959, the Russian probe Luna 3 was taking photographs of the far side of the Moon. All probes to our moon and the planets carry remote sensing and data recording and transmission equipment, providing us with incredible images of the planets.
Remote Sensing Techniques Most remote sensing techniques use electromagneticradiation to obtain information about the target area. * Remote sensing methods can be subdivided into two categories: ACTIVE and PASSIVE. Both categories are used in systems mounted on aircraft, artificial terrestrial satellites and probes to the planets. *Sonar is a form of remote sensing used in and under water to detect submerged objects by using reflected sound waves rather than electromagnetic radiation.
In ACTIVE remote sensing, electromagnetic radiation is emitted by the remote sensing equipment and directed at the target object. It is reflected by the target and detected by the sensor part of the instrument. The reflection provides information about the target. Sensor The main type of active sensor used is radar. This is described further on in this Activity. reflected radiation Emitter emitted radiation Target
Many remote sensing techniques use electromagnetic radiation emitted or reflected by the target object in order to obtain information on the target area. This group of techniques is called PASSIVE remote sensing. In the diagram below, radiation emitted by the sun is partially reflected by the object being observed; it is then detected by the sensor. sensor Sun One example of use is the detection of near infrared radiation reflected by vegetation by means of infrared-sensitive film. reflected light emitted light Click here to find out more about the electromagnetic spectrum
Different types of terrain in the target area act on the electromagnetic radiation hitting them in different ways. For example, a green object will absorb blue and red light, and reflect green. Sensor Blue: Absorbed The sensor will in this case detect just the reflected green light. Green: Reflected Red: Absorbed Green Target Object
A leaf on a plant absorbs blue and red wavelengths of light but reflects green and near infrared. Our eyes cannot detect the latter, so we see leaves as being green. But a sensor which can detect radiation at near infrared wavelengths (around 1 micrometre wavelength) will ‘see’ the leaf in infrared. This would normally be indicated by the colour red in a screen or printed image, to permit us to view the picture in wavelengths which are visible to us. Of course, some other colour must then be used for detected red wavelengths. This can make remotely-sensed images including data in non-visible wavelengths appear confusing until one gets used to them.
Colour and near infrared image of fields in Malta. The red area to the right is a vineyard.The yellow areas all around are fields with bare soil, whilst the orange or pale red areas are poorly-irrigated vegetation, which emit a lower intensity of near infrared. Near infrared images are a good indicator of the health of plants. © Euro-Mediterranean Centre on Insular Coastal Dynamics, Malta. Reproduced with permission.
In the diagram below, heat generated by a power plant is emitted in the form of thermal infrared radiation from chimney stacks and detected by a thermal infrared sensor. • In some instances, the electromagnetic radiation detected by a sensor is emitted directly by the target object. In many cases, the electromagnetic radiation detected by a sensor may be a combination of both reflected and emitted radiation.
Spectrum of one point (or pixel) as measured by the NASA AVIRIS spectrometer The spectrum or signature of a target object as recorded by the sensor or sensors being used gives an indication of the object’s properties, such as its colour, temperature or composition. Each different type of surface reflects or emits a particular spectrum of electromagnetic radiation. By analysing this spectrum, the nature of the target areas observed can be determined.
Certain parts of the electromagnetic spectrum are absorbed by a planet’s atmosphere. Remote sensing cannot be carried out using these wavelengths, as the radiation cannot travel through the atmosphere to reach the sensor without being absorbed. The regions in the spectrum which are not blocked by the atmosphere are called atmospheric windows. Fog and clouds, smoke or smog, or ash from volcano eruptions are all conditions which may prevent remote sensing even within atmospheric windows. The particles making up these features reflect and scatter or absorb certain wavelengths of electromagnetic radiation. A near infrared sensor cannot ‘see’ through clouds on Earth - or Venus - and a sensor operating in a different wavelength has to be used.
(b) Remote Sensing at Different Wavelengths The wavebands most frequently used in remote sensing the surface of a planet are: • ultraviolet electromechanical scanner or CCD • visible film, electromechanical scanner or CCD • near infrared film, electromechanical scanner or CCD • thermal infrared electromechanical scanner • microwave radiometer or radar The devices most commonly used to sense each band of radiation are indicated to the right. All these devices can be used either on aircraft or satellites, and in most cases on both.
Aerial photography is still a frequently used technique. Dedicated high speed cameras are installed in aeroplanes which fly at predetermined altitudes and flight lines in order to obtain a sequence of images. • Ultraviolet to near-infrared wavelengths (1) This method is not used on satellites and probes, as retrieving the film would pose a problem. Photographic film is widely used because of the high resolution which can be obtained. This is made possible by the fine grain of the film. The fast image registration speed permits remote sensing at high aircraft speed and a wide range of altitudes. Infrared-sensitive film, developed for military purposes, has proved particularly useful for agricultural and forestry surveys.
S W A T H E Image 1 Image 2 Image 3 Image 4 Image 5 Image 6 As the aeroplane moves along its flight-path the operator takes a series of pictures of the surface below, capturing images in a sequence or SWATHE mapping out a long, narrow area.
After each flight-line the aeroplane is turned around to map another swathe adjacent to the first. By laying out swathes of images alongside each other, a MOSAIC is formed, mapping the area of interest. Each photo in a swathe overlaps the previous one; similarly, each swathe overlaps the previous swathe. This precaution ensures that no gaps exist in the final composite image. This is important as gusts of wind can easily affect the direction of motion and orientation of an aeroplane, resulting in areas being missed out unless sufficient overlapping is planned for. On the Internet, a movie of an aerial survey can be found at http://www.digitalradiance.com/sng/farming.htm
Although expensive, aerial photography is still used for a wide variety of purposes including: hydrology cartography agricultural surveys urban studies geological surveys forestry surveys The data collected is often compiled in Geographic Information Systems (GIS), which combine layers of maps and images with databases on computer. The main advantages of using aeroplanes are a higher operational flexibility (a satellite remote sensing operation can only be carried out when the satellite overflies, or orbits above, the target area) and a higher resolution of objects on the ground, as an aeroplane can fly lower and closer to the target - although satellites are catching up in this field.
direction of rotation direction of motion • Ultraviolet to near-infrared wavelengths (2) Electromechanical scanning devices have sensors with oscillating or rotating mirrors which reflect an image of a point in the area below them onto a photoelectric detector. As the mirror either oscillates or rotates, a side to side scanning movement is produced which forms a row of data points. The vehicle carrying the sensor moves along its flight path, and a second row of points is recorded. The rows make up a picture as wide as the scan and as long as the flight-line. The data is registered and recorded, or transmitted, electronically, and this technique can therefore be used on satellites and probes. These instruments are also known as across-track or whiskbroom scanners.
Landsat 7 This method of scanning images is frequently used in multi-spectral scanners. These devices have a small battery of photoelectric detectors which record the intensity of radiation emanated from a point in a number of wavebands. For example, a multi-spectral scanner may record the values in ultraviolet, blue, green, red, and two wavebands of near-infrared simultaneously. The Landsat family of satellites have multispectral scanners on board as their main remote sensing instruments.
A more advanced version of the original Landsat Multispectral Scanner instrument is used on some Landsat satellites: this is the Thematic Mapper. It is similar in principle to the multi-spectral scanner, but the selection of the seven wavebands of the scanner was based on specific application requirements.
Landsat 5 Thematic Mapper • Landsat 5 Thematic Mapper image of Miami, Florida.
AVIRIS image in different wavebands. NASA AVIRIS airborne visible and near infrared whiskbroom scanner.
flightline • Ultraviolet to near-infrared wavelengths (3) Charge-Coupled Devices or CCDs are thin wafers of silicon with a surface divided into an array of square light-sensitive picture elements. A CCD can be linear, that is, the picture elements are arranged in a line. In this case, a line of data is captured when the array is exposed to light from the target. As the vehicle carrying the instrument advances along its flightpath or orbit it collects subsequent lines of data which together make up an image. These linear array scanners are also known as along-track or pushbroom scanners.
In other instruments, the CCD array is rectangular. This layout ‘captures’ a rectangular image. This is similar to a photograph, but in this case the image is recorded electronically rather than on film. Images are batched together to form map mosaics in a way identical to that described earlier on for photographic images. This rectangular array layout is also used in digital cameras and some telescopes, including the Hubble Space Telescope.
Near infrared image showing the Cottonera Lines defensive works and a shipyard in Malta. The image was taken using a digital camera with a rectangular CCD array mounted in a light aircraft. The red areas indicate reflection of near infrared radiation by plants. © Euro-Mediterranean Centre on Insular Coastal Dynamics, Malta. Reproduced with permission.
Picture Perfect • Before using the images obtained by remote sensing, the data has to be rectified and processed. This is usually done by means of dedicated computer software (photo images are often scanned to be processed electronically). The images have to be rectified. Any errors due to motion of the vehicle carrying the remote sensing instrumentation are eliminated, and elements within the image located at different altitudes are corrected for perspective. Ground coordinates are added to the image by ‘draping’ it over a digital elevation (or terrain) model during the rectification process. These are required for creating mosaics, for comparing or combining images of the same areas taken using different wavelengths or at different times, and for obtaining measurements from the image.
FILTER The image may then be processed by applying mathematical filters included in the computer software used to clarify or sharpen the image. By combining images taken at different wavelengths - for example, by choosing three different wavebands from a multi-spectral scanner - certain features may be enhanced, permitting the image analyst to clearly identify the details which interest him. For example, selecting green, red and a near-infrared band would enable him to identify vegetation types more clearly.
Thermal infrared remote sensing Thermal infrared remote sensing detects thermal radiation in two wavebands: 3.5 to 5.5 micrometres and 8 to 14 micrometres. Transmittance of thermal radiation in wavelengths between these two regions are blocked by the Earth’s atmosphere. Photoelectric detectors with electromechanical scanner mechanisms are used to detect thermal radiation. The data may be output from the sensor as a linear chart or (as is more often the case) as a false-colour image, each colour depicting a particular temperature range. Thermal imagers can be so sensitive as to detect differences in temperature as small as 0.03K. This sensitivity is called the thermal resolution of the sensor.
The image to the right shows the superstructure of a moored tanker. The redareas are hottest, followed by orange, yellow, green, light blue, dark blue, purple and black. The top surfaces, warmed by the sun, are hottest © Euro-Mediterranean Centre on Insular Coastal Dynamics, Malta. Reproduced with permission. The Prometheus volcano on Io. The farther image was taken in the near infrared; the nearer is a false colour thermal infrared image taken at wavelengths around 4.5micrometres. The highest temperaturearea is coloured white, followed by yellow, red, green and blue.
Remote sensing at microwave frequencies Microwaves have a distinct advantage over the other wavelengths discussedso far: they can easily penetrate clouds and fog. Passive microwave radiometers can detect thermal-related microwave emissions from surface features. One use is the measurement of sea and ice surface temperatures on a large (or global) scale; another is the detection of oil slicks in water. Active microwave remote sensing, utilising any one of a variety of RADAR systems, is another important tool. In this case, the radar emits a microwave beam which is reflected by the target back to the radar system. A simple form of radar is used as an altimeter, giving the altitude of an aeroplane or satellite above a planet’s surface by timing the reflection.
TOPEX/Poseidon image of La Nina weather conditions in the Pacific • The French TOPEX/Poseidon satellite, operated in conjunction with NASA, measures sea level beneath its orbit using radar altimeters. This information is used to relate changes in ocean currents with atmospheric and climate patterns. Measurements from a Microwave Radiometer on the satellite provide estimates of the water-vapor content in the atmosphere. This is used to correct errors in altimeter measurements. These combined measurements allow scientists to chart the height of the sea across ocean basins with an accuracy better than 10 centimeters.
In a Synthetic Aperture Radar (SAR) system,reflected signals are received from targets at successive antenna positions as the vehicle carrying the SAR moves along its path, building up an image which could otherwise be obtained only by using an antenna several hundred metres wide. A very high resolution can therefore be obtained, as the wavelength is small compared to the simulated large antenna. Radar systems are deployed on both aircraft and satellites, and can be used for a wide range of applications including the monitoring of sea- and ocean-going vessels and oil spills, the observation of water conditions, geological surveys and land-use surveys.
One spectacular application of radar (SAR) has been the Magellan Radar Mapper on the Magellan probe to Venus. This instrument gave us our first map of the surface of Venus. Radar was selected because of the thick cloud cover of Venus which absorbs visible and infrared radiation but permits the passage of microwaves. Three dimensional digital elevation models of the surface of Venus could be constructed using views of the same features taken at different angles. (See also the movies of Magellan mapping Venus and the 3D models of the surface on the Universe textbook CD.)
-and how remote sensing techniques can provide images and maps of other planets in our solar system. In this Activity we have seen how remote sensing can reveal features of our own planet and help us control our use - and abuse - of the Earth and its resources-
As we move on to explore our knowledge of the other bodies in our Solar System, bear in mind that the information we have about these bodies has mostly been gathered by remote sensing. • Remote Sensing will be discussed in more detail in the Unit on Studies in Space Exploration.
Image Credits • NASA: TOPEX/Poseidon satellitehttp://www.jpl.nasa.gov/pictures/ • NASA: Cassini probe at Titanhttp://www.jpl.nasa.gov/pictures/ • NASA: Mount Pele on Io from Galileohttp://science.nasa.gov/newhome/headlines/ast19nov99_1.htm • NASA: Marshttp://pds.jpl.nasa.gov/planets/welcome.htm • NASA: Landsat 4http://www.earth.nasa.gov/history/landsat/landsat4.html • NASA: Voyager probehttp://www.jpl.nasa.gov/pictures/ • NASA: Galileo probehttp://www.jpl.nasa.gov/pictures/ • NASA: Cassini probehttp://www.jpl.nasa.gov/pictures/
Image Credits • Euro-Mediterranean Centre on insular coastal Dynamics Malta:colour-near infrared image of vineyards • NASA: Landsat 7 satellitehttp://landsat.gsfc.nasa.gov/ • NASA: Landsat 5 image of Miamihttp://landsat.gsfc.nasa.gov/ • NASA: Landsat 5 thematic mapperhttp://www.earth.nasa.gov/history/landsat/landsat5.html • NASA: AVIRISspectrum,aircraft and sensor, remotely sensed imageshttp://makalu.jpl.nasa.gov/html/overview.html • NASA: Hubble Space Telescopehttp://www510.gsfc.nasa.gov/512/hst.htm • Euro-Mediterranean Centre on insular coastal Dynamics Malta:colour-infrared image of Cottonera Lines and shipyard • Euro-Mediterranean Centre on insular coastal Dynamics Malta:colourimage of countryside in Crete
Image Credits • Euro-Mediterranean Centre on insular coastal Dynamics Malta:thermal image of aft end of moored tanker • NASA: Prometheus volcano on Io by Galileo probehttp://science.nasa.gov/newhome/headlines/ast19nov99_1.htm • NASA: TOPEX/Poseidon image of La Ninahttp://www.jpl.nasa.gov/elnino/991129.html • NASA: Magellan probe at Venushttp://www.jpl.nasa.gov/pictures/
Hit the Esc key (escape) to return to the Module 8 Home Page
The Electromagnetic Spectrum • Visible light is made up of a whole spectrum of colours: Each of which corresponds to a characteristic frequency f (or wavelength ) range, because light, as an electromagnetic wave which travels at the speed of light c, obeys the equation c = f
Optical astronomers observing in visible lightwork between wavelengths of about = 400 nm (or frequency f = 7.5 x 10¹⁴ Hz) - the blue end of the visible spectrum And = 700 nm (or frequency f = 4.3 x 10¹⁴ Hz) - the red end of the visible spectrum. Forgotten what 1014 means? Click here to revise scientific notation.
Radio waves Microwave &Infrared Ultraviolet X rays Gamma rays 300 kHz= 3x10⁵ Hz 1 km The visible spectrum is a small part of the whole electro -magnetic spectrum. 3 GHz= 3x10⁹ Hz 10 cm wavelength frequency 3x10¹³ Hz 10-5 m Visible 1 nm = 10-9 m 3x10¹⁷ Hz 3x10²¹ Hz 10-13 m
Astronomers try to access as much of the electromagnetic spectrum as possible with their telescopes & detectors, ranging from radio waves to gamma rays.