Download
1 / 28
280 likes | 1.13k Views
Covered lagoons + flaring with or without utilization of biogas ... The size of lagoon should be large enough to store at least one month output of manure. ...

E N D
1. CDM Potential in Animal Manure Management and Estimation of Emission Reduction
April 9, 2007 Training for Carbon Finance Unit Flora Tao, Zijun Li, Zarina Azizova
2. Agenda
Potential AMMS CDM projects Applicable methodologies Rule-of-thumb for estimation of ER Key parameters to estimate ER Monitoring of AMMS Other issues related to large scale biogas plant
3. Potential AMMS CDM Project
Animal manure: methane and N2O emissions Baseline: Manure storage methods: Solid, dry, liquid, pits, deep litter, open anaerobic lagoon Project Scenario: Manure treatment system: Anaerobic treatment with methane recovery/utilization Combustion of manure Aerobic treatment Transitions between these alternatives can reduce methane and N2O emissions.
4. Potential of carbon finance in AMMS project activities (cont)
Biogas digester and power generation Minhe Chicken farms Biogas co-generation system project, China Covered lagoons + flaring with or without utilization of biogas Methane Recovery and Utilization Project, Mexico Combustion of chicken litter with or without power generation 3 MW Poultry Litter Fueled Power Project, India
5. Case Study: Minhe Poultry Mature Biogas Project
7. Minhe Poultry Mature Biogas Project
Total chicken population: 3.6 million broiler and 1.4 million breeder Daily fresh manure 500 tons with 20% of Total solid Waste water of 1000 ton from flushing the chicken barn Current practice of manure management: uncovered lagoon Proposed project: Anaerobic Digester + Co-generation Total Investment: 40.7 million RMB O&M Cost: 5.5 million RMB Revenue w/o carbon: 7.6 million Revenue w/ carbon: 14.2 million
8. Combustion of poultry litter for power generation
Baseline: poultry litter disposed of in a landfill CDM Project: combustion of poultry litter to produce electricity and to avoid methane production. Manure should be dry ! Applicable methodology: AMS.III.E Costs: Installed costs per MW is in the range of 1.5 to 3 Mln USD. Rules of thumb: The poultry farm produces 100 tons of dry poultry litter per day which sustains 3MW power plant and reduces 65,000 tons of CERy (45k from metahne avoidance and 20k from electricity displacement).
9. Methane recovery from covered lagoons
Baseline: open anaerobic lagoon CDM project: lined covered lagoon with HDPE geomembrane Applicable methodologies: ACM10 & AMS.III.D Installed costs: USD 150,000 (without power generator) Operational costs: USD 2500 Number of heads: 73,000 swine Estimated ERs: 61k tons of CO2e per annum
11. Applicable approved methodologies
ACM0010 - GHG emission reductions from manure management systems For project with emission reductions below 60kt CO2e/y AMS.III.D � methane recovery in agricultural and agro industrial activities AMS III.E � avoidance of methane production from biomass decay through controlled combustion
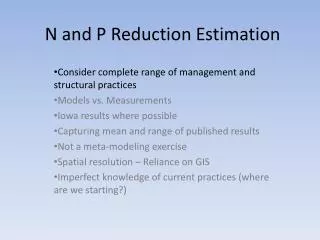
12. Rule of Thumb for ER Estimation (Annual Average Temperature >= 10 C) ECH4,y = GWPCH4,y * DCH4 * MCFj * Bo,LT * N * VSLT,y * MS%Bl,j
13. Important factors to consider
Existing manure treatment system on livestock farms Methane Conversion Factor (MCF) Pasture 1%-2% Daily spread 0.1%-1.0% Solid storage 2%-5% Dry lot 1%-2% Liquid/slurry 17%-80% Uncovered anaerobic lagoon (depth>=1m2) 66%-80% Pit storage under animal confinements 17%-80% Anaerobic digester 0%-100% Aerobic treatment 0%
14. Important factors to consider (cont.)
Climate: Annual average temperature in the baseline site should be higher than 5 C Depth of open lagoons in the baseline scenario: >= 1 m2. The size of lagoon should be large enough to store at least one month output of manure. Livestock species: ACM0010 livestock definition: cattle, buffalo, swine, sheep, goats, and poultry Farm�s livestock capacity: a. Static population b. Growing population: AAP = Days_alive * {NAPA/365} AAP = annual average population NAPA = number of animals produced annually
Animal Population (Layer, Broiler) Anaerobic Digester System Power generation system Aerobic lagoon Project Boundary Biogas CH 4 Con. Biogas flow Rate 2 VS. N Con. Sludge flow rate 5 Operation hours Electricity Meter 2 Electricity Meter 3 Monitoring Plan Grid Electricity Meter 1 by Grid Company Electricity Consumption Meter 4 Land application Biogas flow Rate 1 VS. N. Con. Effluent flow rate 2 VS. N Con. Effluent flow rate 4 Gas tank VS. N. Con. Effluent flow rate3 VS. N. con Manure flow rate 1 Flaring Tower16. Other issues and benefits
Issues: If arsenic is added to the feedstock, ensure that the level of arsenic or other heavy metals in the feedstock are within permissible limits Measure the arsenic content of slurry/compost before land application Benefits: Source for renewable energy Improved quality of fertilizer reduce the burn effect and improve the plant tolerance, balanced P and K in slurry, reduce the germination ability of weed seeds) Environmental benefit reduced nitrate leaching, reduced odour problems, hygienize liquid manure, avoid costs for connection to a central sewer
17. Other issues on large scale biogas plant feasibility and operations
Economic Feasibility Economic value of biogas: access to grid and tariff for the electricity generated from biogas or fuel cost saving for heating/cooking Market value for biogas residue as organic fertilizer for land application Transportation distance in case of centralized biogas plants Security of long-term supply of mature
18. Main Features of modern biogas plant Handling mixed slurry with maximum 8-10 % TS including straw bedding and the like in the input With adequate mixing inside to prevent floating layer build up, to control sand/sediments from building up and to ensure full mix Adequate insulation and reliable and accurate temperature control, Corrosion resistant and gas-proof top construction (that stays gas-proof), Safety measures to protect from damage from pumping errors and gas over or under pressures. Resources of large scale biogas plant technology Biogas plant planning guideline, good practice of management of AD Residues http://www.biogasbranchen.dk/view.asp?ID=1132 Large scale manure based biogas plants in Denmark Configuration and operational experience IRIS under folder CFU-Lesson learned
Other issues on large scale biogas plant feasibility and operations
19. Thank you
20. ANNEX I : Key factors determining methane emissions
Bo, LT (m3 CH4 /kg_dm) Maximum methane production potential of animal type LT. MCF (methane conversion factor) Percentage of feed energy converted to methane. A system-specific index reflecting the portion of Bo that is achieved.
21. Key factors determining methane emissions (cont.)
VS value: (kg-dm/day) volatile solid for livestock LT entering all AWMS. VS influences CH4 content in the manure. Category of animal North America Western Europe Eastern Europe Dairy cattle 5.4 5.1 4.5 Market Swine 0.27 0.3 0.3 Breeding swine 0.5 0.46 0.5 Poultry (Broilers) 0.01 0.01 0.01 Other chickens 0.02 0.02 0.02 Ducks 0.02 0.02 0.02 To measure the country-specific VS values, countries should estimate dietary intake of livestock.
22. Key factors determining N2O emissions
Direct N2O emission Annual N excretion rates (Tier 1) Nex(T ) = Nrate(T)�(TAM/1000)*365 NEXrate,default (kgN/1000kg weight/day) Daily average nitrogen excretion per 1000kg animal
23. Key factors determining N2O emissions (cont.)
TAM (kg) Typical animal mass for livestock category Category of animal North America Western Europe Eastern Europe Dairy cattle 604 600 550 Market Swine 46 50 50 Breeding swine 198 198 180 Poultry (Broilers) 0.9 0.9 0.9 Other chickens 1.8 1.8 1.8 Ducks 2.7 2.7 2.7 IPCC Nintake method (Tier 2) NEX = Nintake * (1-Nretention) the amount of dry matter intake by livestock should be monitored
24. Direct emission factor for N2O-N emissions (kg N2O-N/kg N) Management System Default EF for direct N2O emission Liquid/Slurry 0.005 Uncovered anaerobic lagoon 0 Anaerobic digester 0 Pit storage below animal confinement 0.002 Aerobic treatment 0.01 IPCC EN2O,D =GWPN2O*CFN2O-N,N/1000*EFN2O,D,j *NEX*N* MS%
Key factors determining N2O emissions
25. Indirect N2O emissions (N2O emissions due to volatilization from manure management) Fgasm Fraction of managed manure that volatilizes Category of animal Anaerobic lagoon Pit storage Dairy cattle 35% (20%-80%) 28% (10%-40%) Swine 40% (25%-75%) 25% (15%-30%) Poultry 40% (25%-75%) - IPCC
Key factors determining N2O emissions (cont.)
26. EFN2O,ID (kg N20-N/kg NH3-N and NOx-N) Indirect emission factor for N2O emissions from atmospheric deposition of nitrogen on soils and water surfaces => IPCC defualt volatilisation factors for indirect soil N2O emissions: 0.010 EN2O,ID,Y =GWPN2O*CFN2O-N,N /1000*EFN2O,ID* Fgasm *NEX*N* MS%
Key factors determining N2O emissions (cont.)
27. Leakage from manure projects
Major leakage from manure projects: Methane and N2O emissions due to disposal/land application of the treated manure to the environment. Methane leakage LECH4 = GWPCH4 * DCH4 * MCF * (1-Rvs,n) * Bo * NLT * VSLT * MS% Rvs,n For subsequent treatment stages, Rvs,n is the relative reduction of volatile solids from the previous stage.
28. N2O leakage LEN2O = LEN2O,land + LEN2O,runoff + LEN20,vol * LEN2O,runoff = EF5 * Fleach * (1-RN,n) * NEXLT * NLT EF5 (0.0075) and Fleach (0.3) are affected by the amount of precipitation in the field.
Leakage from manure projects (cont.)