Download

1 / 56
560 likes | 804 Views
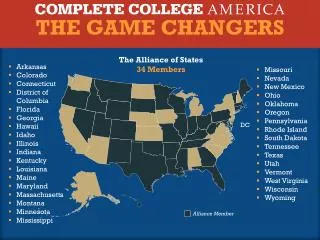
35 Members. Arkansas Colorado Connecticut District of Columbia Florida Georgia Hawaii Idaho Illinois Indiana Kentucky Louisiana Maine Maryland Massachusetts Montana Minnesota Mississippi Missouri. Commonwealth of the Northern Mariana Islands Nevada New Mexico Ohio

E N D
35 Members • Arkansas • Colorado • Connecticut • District of Columbia • Florida • Georgia • Hawaii • Idaho • Illinois • Indiana • Kentucky • Louisiana • Maine • Maryland • Massachusetts • Montana • Minnesota • Mississippi • Missouri • Commonwealth of the Northern Mariana Islands • Nevada • New Mexico • Ohio • Oklahoma • Oregon • Pennsylvania • Rhode Island • South Dakota • Tennessee • Texas • Utah • Vermont • West Virginia • Wisconsin • Wyoming DC Alliance Member
Enrollment at Peak of Recession • Record enrollment • More minority students • More low-income students • More first generation students
Too Few Graduate At All Full Time Students (150% of time) 4-year Bachelor’s (Non-Flagship) 2-year Associate 12.9% 43.2%
Part-Time Students Rarely Graduate Part Time Graduation Rates 2-year Associate 4-year Bachelor’s (Non-Flagship) 6.9% 15.9% 200% time = 4 years for associate, 8 years for bachelor’s
1. Performance Funding & Metrics 2. Corequisite Remediation 3. Time and Intensity 4. Guided Pathways - GPS 5. Structured Schedules
Metrics Data drives change! Remediation- Gateway courses Credit hours earned Time to degree Certificates and Degrees Data drives change!
GAME CHANGER Performance Funding- provides incentives
GAME CHANGER Corequisite Remediation
CorequisiteRemediation Provide academic support as a Corequisite not as a prerequisite
The Corequisite Strategy More time on task and help for students when they need it (just in time).
Corequisite Options • 45 minutes after class • An additional class period or two • Required lab with mentors • 5 weeks dev ed, 10 weeks regular course (5 days/wk)
Ivy Tech Community College • Before: 25% of remedial English students completed the college levelEnglish course in three semesters. • Now: over 50% complete in one semester. • Before: 9% of math remedial students completed the college level math course in three semesters. • Now: over 50% complete in one semester.
College Algebra’s Only Purpose:Preparation for Calculus STEM
Math Is Aligned with Meta-Majors Quantitative Reasoning/ Statistics
Current Model Enrolls Most Students into Remediation Remediation Gateway Percent of Students 70% 30% Student Placement Data
New Model Enrolls Most in College Gateway Course with Corequisite Support Test Prep or Technical Certificate Gateway Percent of Students 10% 60% 30% Student Placement Data
GAME CHANGER Time & Intensity
A NATIONAL PROBLEMVery Few Graduate on Time … On-Time Graduation Rates(Full-time students) 4-year Bachelor’s (Non-Flagship) 2-year Associate 5.0% 18.1%
Time and Intensity The longer it takes…the more life gets in the way.
The Power of 15 Credits: More students graduate when they complete 30+ credits in their first year.
The Power of 15 Credits: More students graduate when they complete 30+ credits in their first year.
Most students DON’T take the credit hours necessary to graduate on time. Full-time Students Taking 15+ Credits Per Semester
IUPUI 15 to Finish 15 or > credit hours attempted- First time Full time
GAME CHANGER Guided Pathways to Success
Graduating on time is a myth in American higher education. 2-Year Institutions 3.6 years 4-Year Institutions (Non-Flagship) 4-Year Institutions (Flagship) 4.9 years 4.4 years
Too Many Credits 2-year Associate 4-yearBachelor’s(Non-Flagship) 136.2credits accumulated 78.8credits accumulated 60credits standard 120credits standard Does NOT count remediation
Too Many Choices and Too Little Guidance Why GPS? • Most colleges have more than 100 majors and hundreds of courses. • Most students are unaware of their career options. • 45% of students haven’t seen a counselor by the third week of class.
1 counselor : 400 students Why GPS?
Behavioral Economics: Choice Why GPS? Too much choice — especially uninformed choice — leads to poor decisions.
Behavioral Economics: Default Why GPS? People accept — even welcome — a default choicedesigned by informed professionals.
New Model – Structured Programs Nursing Engineering Honors Choice Architecture An academic semester-by-semester plan: a clear path to graduation.
GPS: Essential Components DO THIS • Default Pathways • Choosing Majors • Meta-Majors • Academic Maps • Critical Path Courses • Intrusive Advising
The Default Path Behavioral Economics Students don’t “discover” the right path; after choosing a major, the academic map is the default schedule.
Meta Majors STEM HUMANITIES HEALTH SCIENCES BUSINESS SOCIAL SCIENCES ARTS EDUCATION
Meta-Major to Majors • Help students make the big choices (a meta major/major). • Once in a meta-major, help students narrow their study to a major. • A semester-by-semester academic map is the sequential, prescriptive schedule of classes for the meta-major and the major.
ACADEMIC MAPS: 4 essential components – the narrative, sample schedule, milestones and employment opportunities The narrative explains the use of academic maps and any specific information about degree requirements, including admissions requirements The sample schedule outlines which courses should be taken in which specific term in order to satisfy all requirements The milestones identify critical courses for timely progress and the last semester in which they can be completed for on-time graduation. Critical grades for Milestone courses may be included. List of Representative Job Titles and Potential Employers
Critical Path Courses • Prerequisite courses are designated for each semester. • Taken in the recommended sequence. • The college guarantees the critical path courses are available.
Intrusive Advising • Students must see their advisors before registering for classes if: • they do not complete the critical path course on schedule • they fall 2 or more courses behind on their academic map • they have a 2.0 GPA or less for the semester
Georgia State University GPS SUCCESS • Degree maps and intrusive advising • Graduation rates up 20 percentage points in past 10 years • Graduation rates higher for: • Pell students, at 52.5% • African American students, at 57.4% • Hispanic students students, at 66.4% • More bachelor’s degrees to African-Americans than any other U.S. university
Florida State University GPS SUCCESS • Since starting degree maps, FSU has cut the number of students graduating with excess credits in half • Graduation rate increased to 74% • African Americans to 77% • First-generation Pell students to 72% • Hispanic students to more than 70%
GAME CHANGER Structured Schedules
GAME CHANGER Structured Schedules Block schedules of classes Cohorts of students Students choose programs or majors, not courses Attendance required