Download
1 / 115
1.17k likes | 2.19k Views
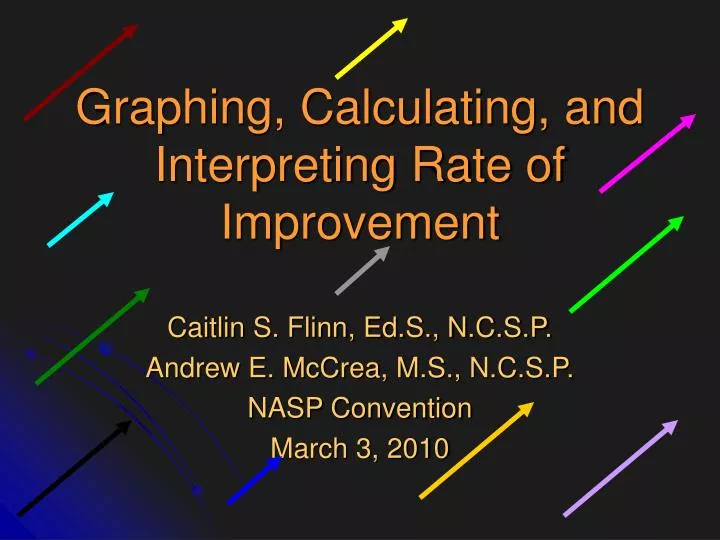
Graphing, Calculating, and Interpreting Rate of Improvement. Caitlin S. Flinn, Ed.S., N.C.S.P. Andrew E. McCrea, M.S., N.C.S.P. NASP Convention March 3, 2010. Objectives. There needs to be a standardized procedure for calculating RoI We’re proposing a method using Simple Linear Regression.

E N D
Graphing, Calculating, and Interpreting Rate of Improvement Caitlin S. Flinn, Ed.S., N.C.S.P. Andrew E. McCrea, M.S., N.C.S.P. NASP Convention March 3, 2010
Objectives • There needs to be a standardized procedure for calculating RoI • We’re proposing a method using Simple Linear Regression
Importance of RoI RoI Research A Need for Consistency Calculating RoI Individual Student Graphs Programming Excel Decision Making Grounding the Data Interpreting Growth Individual Student Student Groups Considerations Resources Overview
Importance of Graphs • Vogel, Dickson, & Lehman, 1990 • Speeches that included visuals, especially in color, improved: • Immediate recall by 8.5% • Delayed recall (3 days) by 10.1%
Importance of Graphs • “Seeing is believing.” • Useful for communicating large amounts of information quickly • “A picture is worth a thousand words.” • Transcends language barriers (Karwowski, 2006) • Responsibility for accurate graphical representations of data
Reading Oral Reading Fluency (ORF) Word Use Fluency (WUF) Reading Comprehension MAZE Retell Fluency Early Literacy Skills Initial Sound Fluency (ISF) Letter Naming Fluency (LNF) Letter Sound Fluency (LSF) Phoneme Segmentation Fluency (PSF) Nonsense Word Fluency (NWF) Spelling Written Expression Behavior Math Math Computation Math Facts Early Numeracy Oral Counting Missing Number Number Identification Quantity Discrimination Skills Typically Graphed
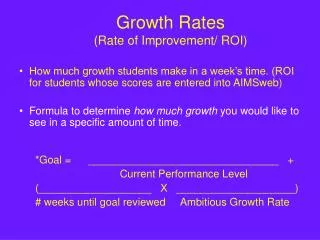
Importance of RoI • Multi-tiered model • Progress monitoring • Data for decision-making • Goal setting (Shapiro, 2008)
Importance of RoI • Visual inspection of slope • Multiple interpretations • Instructional services • Need for explicit guidelines
RoI Research • Deno, 1985 • Curriculum-based measurement • General outcome measures • Short • Standardized • Repeatable • Sensitive to change
RoI Research • Fuchs & Fuchs, 1998 • Hallmark components of Response to Intervention • Ongoing formative assessment • Identifying non-responding students • Treatment fidelity of instruction • Dual discrepancy model • One standard deviation from typically performing peers in level and rate
RoI Research • Ardoin & Christ, 2008 • Slope for benchmarks (3x per year) • More growth from fall to winter than winter to spring • Might be helpful to use RoI for fall to winter • And a separate RoI for winter to spring
RoI Research • Fuchs, Fuchs, Walz, & Germann, 1993 • Typical weekly growth rates • Needed growth • 1.5 to 2.0 times typical slope to close gap • Example • Bob is below benchmark on ORF • Typical slope is 1 wcpm per week growth • Bob would need slope of 1.5 to 2 to close gap in a reasonable amount of time
RoI Research • Deno, Fuchs, Marston, & Shin, 2001 • Slope of frequently non-responsive children approximated slope of children already identified as having a specific learning disability
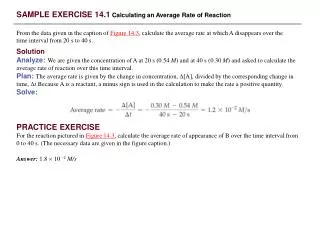
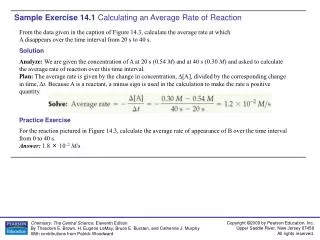
RoI Research • Algebraic term: Slope of a line • Vertical change over the horizontal change • Rise over run • m = (y2 - y1) / (x2 - x1) • Describes the steepness of a line (Gall & Gall, 2007)
RoI Research • Finding a student’s RoI = finding the slope of a line • Using two data points on that line • Finding the line itself • Linear regression • Ordinary Least Squares
RoI Research • Gall & Gall, 2007 • 10 data points are a minimum requirement for a reliable trendline • How does that affect the frequency of administering progress monitoring probes?
RoI Research • Using RoI for instructional decisions is not a perfect process • Research is currently looking to address sources of error: • Christ, 2006 – standard error of measurement for slope • Ardoin & Christ, 2009 – passage difficulty and variability • Jenkin, Graff, & Miglioretti, 2009 – frequency of progress monitoring
RoI Research • Questions yet to be empirically answered • What parameters of RoI indicate a lack of RtI? • How does standard error of measurement play into using RoI for instructional decision making? • How does RoI vary between standard protocol interventions? • How does this apply to non-English speaking populations?
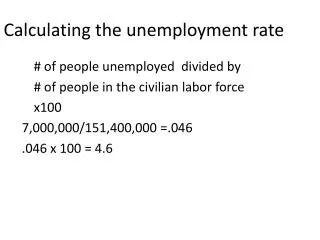
Multiple Methods for Calculating Growth • “Eye ball” Approach • Last point minus First point Approach • Split Middle Approach • Linear Regression Approach
RoI Consistency? • If we are not all using the same model to compute RoI, we continue to have the same problems as past models, where under one approach a student meets SLD criteria, but under a different approach, the student does not. • Hypothetically, if the RoI cut-off was 0.65 or 0.95, different approaches would come to different conclusions on the same student.
Technical Adequacy • Without a consensus on how to compute RoI, we risk falling short of having technical adequacy within our model.
Literature shows that Linear Regression is Best Practice • Student’s daily test scores…were entered into a computer program…The data analysis program generated slopes of improvement for each level using and Ordinary-Least Squares procedure (Hayes, 1973) and the line of best fit. • This procedure has been demonstrated to represent CBM achievement data validly within individual treatment phases (Marston, 1988; Shinn, Good, & Stein, in press; Stein, 1987). Shinn, Gleason, & Tindal, 1989
Growth (RoI) Research using Linear Regression • Christ, T. J. (2006). Short-term estimates of growth using curriculum based measurement of oral reading fluency: Estimating standard error of the slope to construct confidence intervals. School Psychology Review, 35, 128-133. • Deno, S. L., Fuchs, L. S., Marston, D., & Shin, J. (2001). Using curriculum based measurement to establish growth standards for students with learning disabilities. School Psychology Review, 30, 507-524. • Good, R. H. (1990). Forecasting accuracy of slope estimates for reading curriculum based measurement: Empirical evidence. Behavioral Assessment, 12, 179-193. • Fuchs, L. S., Fuchs, D., Hamlett, C. L., Walz, L. & Germann, G. (1993). Formative evaluation of academic progress: How much growth can we expect? School Psychology Review, 22, 27-48.
Growth (RoI) Researchusing Linear Regression • Jenkins, J. R., Graff, J. J., & Miglioretti, D.L. (2009). Estimating reading growth using intermittent CBM progress monitoring. Exceptional Children, 75, 151-163. • Shinn, M. R., Gleason, M. M., & Tindal, G. (1989). Varying the difficulty of testing materials: Implications for curriculum-based measurement. The Journal of Special Education, 23, 223-233. • Shinn, M. R., Good, R. H., & Stein, S. (1989). Summarizing trend in student achievement: A comparison of methods. School Psychology Review, 18, 356-370.
So, Why Are There So Many Other RoI Models? • Ease of application • How many of us want to calculate OLS Linear Regression formulas (or even remember how)?
Get Out Your Laptops! Or Kindly Look Over Your Neighbor’s Shoulder! I love ROI
Open Microsoft Excel • Microsoft Office 2003 for PCs • Microsoft Office 2007 for PCs • Microsoft Office for Macs
Graphing RoI For Individual Students
Setting Up Your Spreadsheet • In cell B2, type School Week • In cell C2, type Benchmark • In cell D2, type WPM (or Student Scores)
Labeling School Weeks • In cell B3, type 1 • Continue entering numbers through 36 in column B • Week 36 will be in cell B38
Entering Benchmarks • In cell C3, type the fall benchmark 77 • In cell C20, type the winter benchmark 92 • In cell C38, type the spring benchmark 110
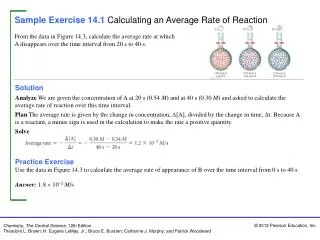
Entering Student Data Points • Student data points are entered between cells D3 and D38. • Type the student’s score next to the corresponding week that it was administered.
Entering Student Data Points • Week 1 – 41 • Week 8 – 62 • Week 9 – 63 • Week 10 – 75 • Week 11 – 64 • Week 12 – 80 • Week 13 – 83 • Week 14 - 83
Entering Student Data Points • Week 15 – 56 • Week 17 – 104 • Week 18 – 74 • Week 20 – 85 • Week 21 – 89 • Week 22 – 69 • Week 23 – 85
Entering Student Data Points • Week 24 – 96 • Week 25 – 90 • Week 26 – 84 • Week 27 – 106 • Week 28 – 94 • Week 32 – 100
*CAUTION* • If a student was not assessed during a certain week, leave that cell blank • Do not enter a score of Zero (0) it will be calculated into the trendline and interpreted as the student having read zero words correct per minute during that week.
Creating a Graph • Highlight the data in Columns C and D • Include cells C2 and D2 through cells C38 and D38 • Include any blank cells
Excel 2003/Macs Click Insert Click Chart Excel 2007 Click Insert Find the icon for Line Click the arrow below Line Creating a Graph
Excel 2003/Macs A Chart Wizard window will appear Excel 2007 6 graphics appear Creating a Graph
Excel 2003/Macs Choose Line Choose Line with markers Excel 2007 Choose Line with markers Creating a Graph
Excel 2003/Macs Data Range tab Columns Excel 2007 Your graph appears Creating a Graph
Excel 2003/Macs Chart Title School Week (X Axis) WPM (Y Axis) Excel 2007 Change your labels by clicking on the graph Creating a Graph