Download
1 / 2
30 likes | 285 Views
Excel is a powerful tool for data analysis that offers various functions, formulas, and features to help you manipulate and analyze data effectively. Here are some common techniques and steps involved in data analysis with Excel:<br><br>Data Import: Start by importing your data into Excel. You can do this by copying and pasting the data directly into a worksheet or by using the "Open" or "Import" functions to load data from external sources such as CSV files, text files, or databases.<br><br>Data Cleaning and Preparation: Before analyzing the data, it's essential to clean and prepare it. This may involve

E N D
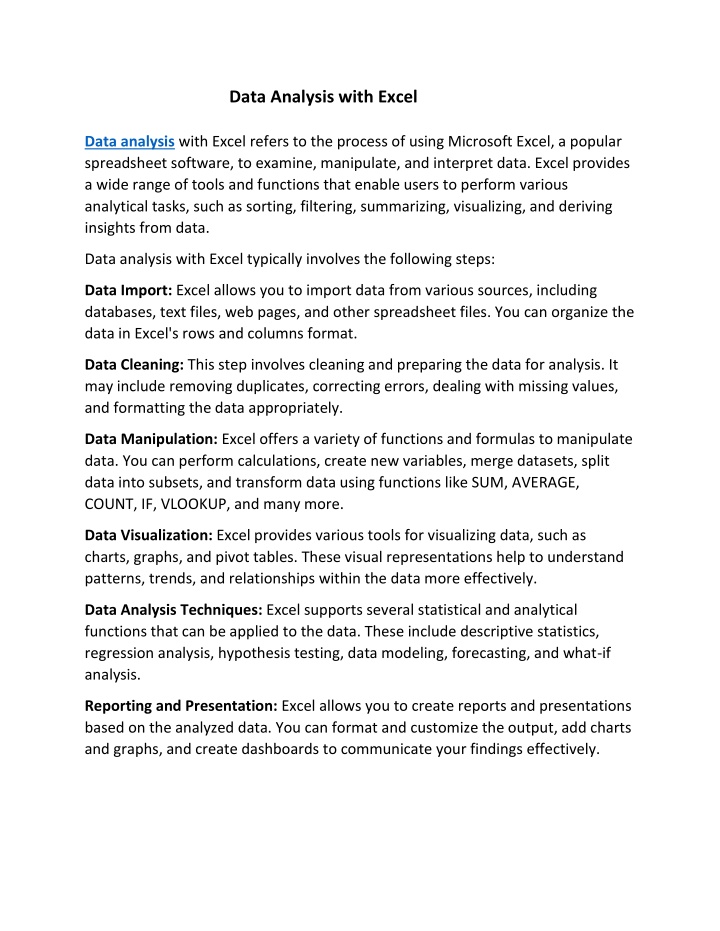
Data Analysis with Excel Data analysis with Excel refers to the process of using Microsoft Excel, a popular spreadsheet software, to examine, manipulate, and interpret data. Excel provides a wide range of tools and functions that enable users to perform various analytical tasks, such as sorting, filtering, summarizing, visualizing, and deriving insights from data. Data analysis with Excel typically involves the following steps: Data Import: Excel allows you to import data from various sources, including databases, text files, web pages, and other spreadsheet files. You can organize the data in Excel's rows and columns format. Data Cleaning: This step involves cleaning and preparing the data for analysis. It may include removing duplicates, correcting errors, dealing with missing values, and formatting the data appropriately. Data Manipulation: Excel offers a variety of functions and formulas to manipulate data. You can perform calculations, create new variables, merge datasets, split data into subsets, and transform data using functions like SUM, AVERAGE, COUNT, IF, VLOOKUP, and many more. Data Visualization: Excel provides various tools for visualizing data, such as charts, graphs, and pivot tables. These visual representations help to understand patterns, trends, and relationships within the data more effectively. Data Analysis Techniques: Excel supports several statistical and analytical functions that can be applied to the data. These include descriptive statistics, regression analysis, hypothesis testing, data modeling, forecasting, and what-if analysis. Reporting and Presentation: Excel allows you to create reports and presentations based on the analyzed data. You can format and customize the output, add charts and graphs, and create dashboards to communicate your findings effectively.