Download
1 / 29
290 likes | 620 Views
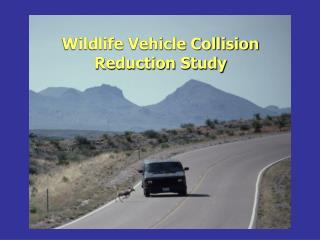
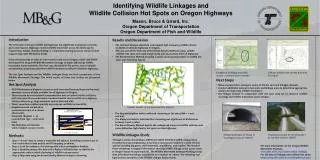
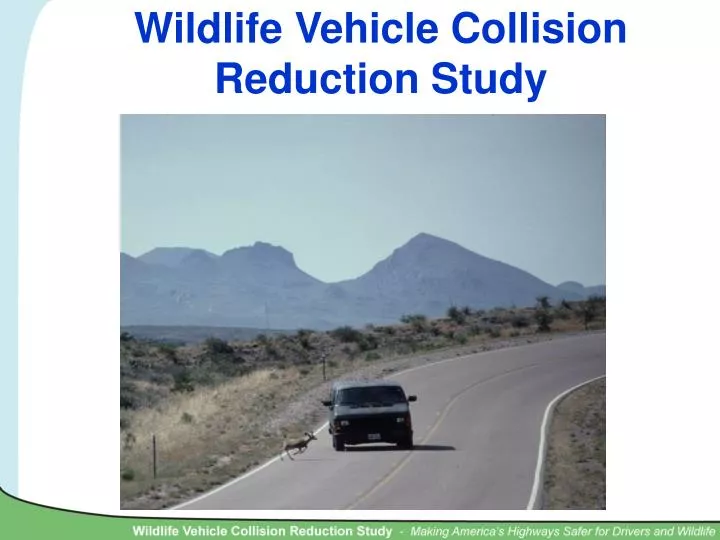
Wildlife Vehicle Collision Reduction Study. Why this Study. Advance the understanding of the causes and impacts of wildlife vehicle collisions Review methods to reduce collisions between motor vehicles and wildlife Describe solutions to this growing safety problem. Goals of the Study.

E N D
Advance the understanding of the causes and impacts of wildlife vehicle collisions Review methods to reduce collisions between motor vehicles and wildlife Describe solutions to this growing safety problem Goals of the Study Sign and flashing lights, part of an animal detection warning system
Summary of Findings“By the Numbers” • An estimated 200 people die each year from WVCs. • 89% of WVCs occur on two-lane roads • WVCs occur more frequently in the early morning (5-9 a.m.) and evening (4 p.m. – midnight), when animals are more active. • An estimated one to two million WVCs with large animals occur annually in the US. • More than 98% of WVCs are single vehicle crashes. • The vast majority (as high as 90% in some states) of reported WVCs involve deer.
WVCs are increasing compared to Total Crashes (Data Source: GES)
Annual WVCs Estimated by Insurance Industry (Data Source: State Farm Insurance)
Monthly Distribution of WVCs 0.25 FARS HSIS GES 0.2 0.15 Proportion of Collisions 0.1 0.05 0 JAN FEB MAR APR MAY JUN JUL AUG SEP OCT NOV DEC (Data Source: FARS, HSIS, GES)
0.12 Time-of-Day Distribution FARS GES HSIS 0.1 0.08 Proportion of Collisions 0.06 0.04 0.02 0 0 1 2 3 4 5 6 7 8 9 10 11 12 13 14 15 16 17 18 19 20 21 22 23 Hour of Day (Data Source: FARS, GES, HSIS)
100% WVC ALL WVCs by Number of Lanes On Road 80% 60% Percent of Accidents 40% 20% 0% 1 2 3 4 5 6 7 Number of Lanes (Data Source: GES).
0.6 ALL Accident Distribution by Posted Speed Limit 0.5 WVC 0.4 Proportion of Accidents 0.3 0.2 0.1 0 5 10 15 20 25 30 35 40 45 50 55 60 65 70 75 Speed Limit (Data Source: GES).
WVC ALL 0.7 Crashes by Average Daily Traffic 0.6 0.5 0.4 Proportion of Collisions 0.3 0.2 0.1 0 1 to 5001- 10,001- 15,001- 20,001- 25,001- 30,001- >35,000 5000 10,000 15,000 20,000 25,000 30,000 35,000 (Data Source: HSIS) ADT
Severity of Injury Distribution for WVCs vs. All Crashes All Collisions WVCs Only 0.5% 0.5% 1.7% 4.3% 0.04% 2.3% 9.4% None None Possible Possible 17.6% Minor Minor Severe Severe Fatal Fatal 68.3% 95.4% (Data Source: GES).
0.05 Age Distribution for All Crashes and WVCs 0.04 All WVC 0.03 Proportion of Collisions 0.02 0.01 0 1 11 21 31 41 51 61 71 81 91 Driver Age (Data Source: HSIS).
Up to $8 billion annually. Injury, property damage, crash scene response and investigation. Estimated Costs of WVC
3.1% 0.6% 10.3% 15.1% DEER DEER LIVESTOCK MOOSE 20.4% OTHER ANIMAL BEAR NON-ANIMAL OTHER SPECIES Animal Species Involved in Collisions 14.9% 81.2% 54.4% Maine California (Data Source: HSIS).
Mammals Bighorn sheep peninsular California population Key Deer,San Joaquin Kit Fox,Canada Lynx Lower Keys Marsh Rabbit Florida Panther,Red Wolf Birds: Audubon's Crested Caracara Hawaiian Goose Florida Scrub Jay Herptiles California Tiger Salamander Flatwoods Salamander Houston Toad American Crocodile Desert Tortoise Gopher Tortoise Alabama Red-bellied Turtle Bog Turtle, northern population Copperbelly Water Snake Eastern Indigo Snake ESA Listed Species Impacted by WVC’s Direct road mortality is the major threat or among the major threats to survival probability….
Mitigation Measures Shown to be Effective • Wildlife fencing • Underpasses and overpasses with fencing
Wildlife Fencing • Reported reductions in WVCs: 80-99% • Several types of material are used, page-wire or cyclone fence material most common • Electric fencing also possible • Maintenance is a major concern Wildlife fencing along US Hwy. 93 on Flathead Indian Reservation, MT
Wildlife Crossing with Fencing • 87% average reduction in WVCs • Used extensively by a wide array of species • Associated fencing • Keeps animals off the road • Funnels animals towards the crossing New highway underpass with fencing
Promising Mitigation Measures to be Further Investigated • Animal detection systems • Reduce speed by traffic calming or reducing the design speed • Seasonal wildlife warning signs • Reduce speed by reducing the posted speed limit • Wildlife crossing guards • Large, non-standard wildlife warning signs • Reduce traffic volume on road networks • In-vehicle warnings: roadside animal detection system communicating with on-board computers • In-vehicle warnings: on-board animal detectors • Roadway lighting to increase visibility
Promising Mitigation Measures, to be Further Investigated • Increasing visibility through vegetation removal • Stop the use of road salt or consider alternate deicers • Influence plant species in the roadside to limit forage values • Reduce population size through wildlife culling • Reduce population size through habitat alteration • Boulder barriers • Wider more reflective striping along white line • Expanded medians
Animal Detection Systems • Systems use sensors to detect large animals that approach the road • Warning signals are activated to inform drivers a large animal may be on/near the road • Warning signals are extremely time specific – short duration • Two major types: area-cover and break-the-beam systems • 82% reduction in WVCs reported in Switzerland Experimental animal detection system in Yellowstone NP
Long Tunnels and Long Bridges • ~ 100% effective in WVC reductions, but very expensive • At least 200-300 hundred feet long, sometimes longer • Allow unhindered animal movements at major connectivity points Long bridge on Arizona SR260
Reduce Speed by Traffic Calming, Reducing Design Speed Roadkill by Posted Speed Limit in Yellowstone National Park 20 15 10 Roadkill per Mile 5 0 15 25 35 40 45 55 Posted Speed (Data Source: Gunther et al. 1998). Speed Bumps Used to Reduce WVCs in Australia
Ineffective or Questionable Measures to reduce WVC’s • Standard wildlife warning signs • Deer reflectors and mirrors • Audio signals in the right-of-way or deer whistles on vehicles • Olfactory repellants • Deer flagging models • Hazing • Intercept feeding • Wildlife relocation in order to reduce population size • Anti-fertility treatment in order to reduce population size • Seasonal road closures • Reflective collars placed on wildlife
Next steps • WVC training manual • WVC training course