Download
1 / 33
380 likes | 1.26k Views
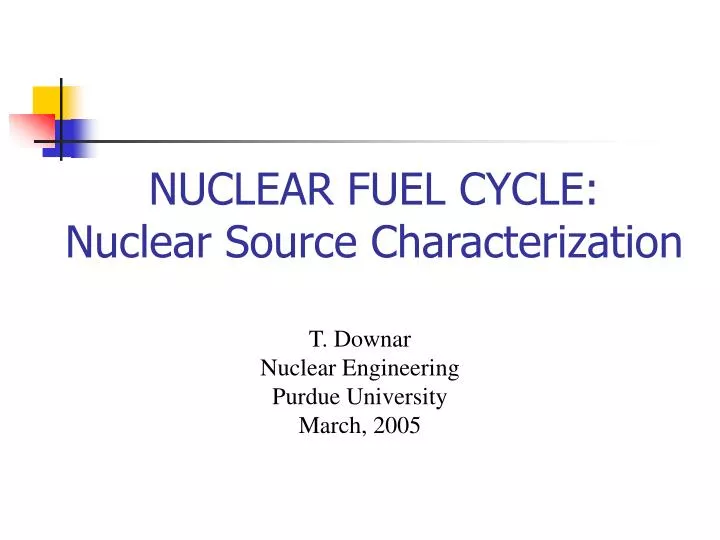
NUCLEAR FUEL CYCLE: Nuclear Source Characterization T. Downar Nuclear Engineering Purdue University March, 2005 THE NUCLEAR FUEL CYCLE

E N D
NUCLEAR FUEL CYCLE:Nuclear Source Characterization T. Downar Nuclear Engineering Purdue University March, 2005
THE NUCLEAR FUEL CYCLE • The Nuclear Fuel Cycle consists of sequence of steps in which uranium ore is mined, milled, enriched, and fabricated into nuclear fuel and then irradiated in a reactor for several years. • The entire fuel cycle lifetime from mining to discharge is about 8 years.
Fuel Cycle Economics • Transaction Cost:mills/kwhr(e) • Ore 1.00 • Conversion 0.15 • Enrichment 1.10 • Fabrication 1.60 • Disposal 1.00 • Misc 0.25 • Total 5.10
Nuclear Energy Costs • Fuel Cycle 0.5 cents/ kwhr(e) • “Busbar” Cost* ~5.0 cents/ kwhr(e) • Total annual Value of electricity from typical nuclear plant: 1000E3KW x 8760hr x 0.90 x 0.05 = 394E6dollars • Value of annual fuel loading in a nuclear plant 0.5E6 dollars/fuel assembly x 64 assemblies = 32E6dollars
Nuclear Electricity Cost Model • Fuel Cycle Cost: ef • i=fuel cycle transaction (e.g. enrich, fabrication, etc) • C=Cost for transaction “i” • M=Mass of fuel for transaction “i” • F=Financing Factor • Busbar Cost: eb • L=Capacity Factor • A=capital costs • I=construction costs • O=operating costs • K=plant power rating • System energy costs: es • er = replacement energy costs
THE NUCLEAR FUEL CYCLE • After irradiation the fuel is cooled in the spent fuel pit for several years and then moved to dry cask storage on the reactor site. • Current plans are to open the YUCCA Mountain high level waste repository in 2015
Spent Nuclear Fuel Pool • Keep spent fuel rods under at least 20 feet of water to provide adequate shielding from the radiation for anyone near the pool • Spent Fuel Pools were designed as TEMPORARY storage for fuel while short lived isotopes decay (<1 yr)
Nuclear Plant Schematic Containment (Hardened Structure) Fuel Building(Soft Structure)
Long Lived Radioactive Isotopes in Discharged Nuclear Fuel • Fission Products • Over 60 isotopes • 7 isotopes have significant gamma decay during first 20 years that can be useful to identify the source: Zr95, Nb95, Ru103, Cs134, Cs137, Ce141, Ce144 • Actinides • Over 20 isotopes • The gamma rays generated by Actinides have lower energy
Parent 1 Parent 2 Fission Decay 2 Yield Yk Decay 1 Capture Neutron σk Capture Neutron σj->k Iso. j Iso. k Decay k Fission Product build up in a Nuclear Reactor • Nuclide balance: • Governing Equation: • Half Life:
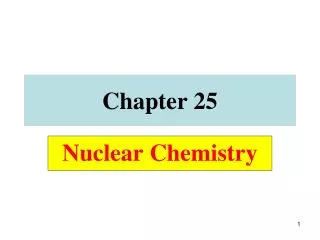
0.8% 95mNb 86.6h 94.6% 99.7% 103mRh 56.12m 95Zr 64d 103Ru 39.35d 94.5% 134Cs 2.026y 95Nb 35d 103Rh 99.2% 5.4% 0.3% 1.4% 144mPr 7.2m 141Ce 32.5d 137mBa 2.552m 144Ce 284.3d 137Cs 30.17y 154Eu 8.8y 144Pr 17.28m 137Ba 98.6% 106Ru 368.2d 103mRh 29.9s Fission Product Decay Chains • Red isotopes have short half lives, they decay out within one year • Blue isotopes have gamma decays in longer period • Other isotopes are either stable, such as 103Rh, or very short half lives. • The gamma decay from very short half life isotope can be taken count with their parent isotopes
Decay rates of Actinides in typical PWR spent fuel 150 days after discharge
Inventory of Nuclear Fuel United States • 103 nuclear power plants • 22% of electrical power World • 438 nuclear power plants (33 under construction) • 17% of electrical power • 30 countries use nuclear power • 16 countries produce more than 25% of electrical power using nuclear energy
Proliferation of Nuclear Materials • Worldwide there exists on the order of a million metric tons of nuclear material from the commercial nuclear industry alone (400 plants x 50 tons/year x >20 years). • When combined with military waste and medical isotopes, the potential data base to catalogue the complete inventory of nuclear materials can not be accessed in “real time”
Motivation for Radiation Source Characterization • The decision making for response to the detonation of a “Dirty Bomb” requires methods that can rapidly characterize and identify the origin of the nuclear materials used in the bomb. • If the material is from nuclear spent fuel, three parameters are important to identify the origin of the source: • Cooling time: time after it is discharged from the reactor • Burnup: the amount of fuel used up in the reactor • Reactor type: whether it comes from a PWR (Pressured Water Reactor) or a BWR (Boiling Water Reactor)
PWR vrs BWR Are the nuclide inventories sufficiently different between these two types of reactors to enable distinguishing whether proliferated nuclear source came a PWR or a BWR? PWR (1/8) Assembly BWR Assembly
Fission Product Densities in PWR as a Function of Fuel Irradiation Time (Burnup)
Radiation Detection Equipmentwww.canberra.com • Commercial “Field” Detection Equipment • Inspector1000 Handheld Radiation Identifier • Inspector2000 Portable Spectroscopy Workstation • Multichannel Analyzer • Nuclide Identification / Activity • The technology exists to rapidly characterize a nuclear source by isotope and activity • How do we identify the origin of the nuclear source?
Artificial Neural Networks (ANN) • Artifical Neural Networks (ANN) have been well established as accurate and efficient tools for a wide variety of practical applications.* In the work here we will train neural networks using isotopics data from all known possible sources of radionuclides. • Sufficient differences exist in the radioactive decay of the nuclides and in the irradiation spectrum of the various nuclear power plants in the world that there should be sufficient differences in the characteristics of the nuclear materials and their radiation fingerprint. * [Tsoukalas, 1997] Tsoukalas, Uhrig “Fuzzy and Neural Approaches in Engineering,” Wiley, 1997.
Mdiecal Military BWR PWR Nuclear Source Characterization/ Identification with ANNs Hand-held Detector GammaSpectra Pattern Transformation Neural Networks Pattern Recognition Decision Making
Artificial Neural Networks (ANN) • A hierarchical approach is used to isolate the origin of the source. • For example, at the highest level, the ANN will be trained to identify whether the nuclear materials came from a commercial reactor, a military waste site, medical facility, etc. • At the next level, the ANN will be trained to identify the specific type of commercial power reactor (e.g. pressurized vrs boiling water reactor) and then to identify the specific plant by using information on the plant operating history.
Ru106/Cs137 Cs134/Cs137 Ce141/Cs137 Ce144/Cs137 Eu154/Cs137 A Typical Run of the Neural Network -1: PWR +1: BWR ? = GwD/T Year Ratios as Inputs Trained Neural Net Neural Net Output Desired Target
Summary • The ANN approach is an advanced analysis algorithm that can be integrate with any hand-held gamma detector and is capable of identifying commonly seen isotopes. • It provides forensic clues of sources’ origins: medical uses, industrial or nuclear spent fuel. For nuclear spent fuel, it further provides possible type of reactor: BWR, PWR, etc. • The required resources (CPU time and memory storage) are nominal and can be easily integrated with any hand-held device to provide information in real time on the scene. • It relies on advanced software technologies and the implementation is very low cost and operates automatically without human operators’ interferences.