Download
1 / 19
220 likes | 1.54k Views
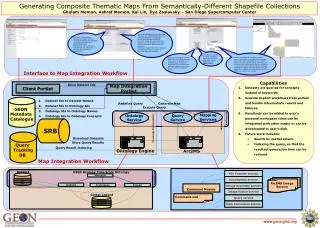
Thematic Maps Sandra Yeboa & Willis Holden What are Thematic Maps & What Do they Do? Maps that… Accent a particular geographic attribute or relationships between several attributes Transform geographic data into geographic information Reveal spatial patterns Thematic vs. Reference Maps

E N D
Thematic Maps Sandra Yeboa & Willis Holden
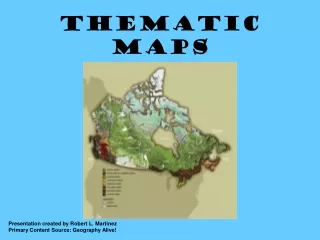
What are Thematic Maps & What Do they Do? Maps that… • Accent a particular geographic attribute or relationships between several attributes • Transform geographic data into geographic information • Reveal spatial patterns
Thematic vs. Reference Maps • Highlights geographic distribution of a particular attribute (ex. Population change) • Highlight many features and geographic attributes
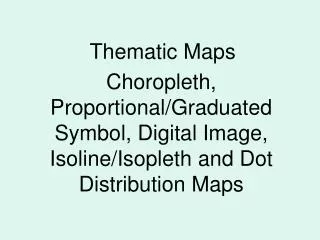
Thematic Maps • Characterized by the use of abstract, graphic symbols that represent quantities and qualities that make locations meaningful • Symbols are varied in color, size, and shape to further accentuate spatial patterns • Examples of varied geographic data attributes: counts, density, rates etc.
Counts, Rates, & Densities • Counts: numbers representing people grouped according to population and housing (ex. U.S. census data are reported as grouped counts in geographically similar areas) • Rates: process of dividing one count by another (ex. Women as a percentage of population) • Densities: count divided by geographic area of grouped counts • (ex. Person per square kilometer)
Thematic Mapping:Mapping counts • Simplest way is mapping a symbol for every individual • Cons: complicates things when population is large
Thematic Mapping:Proportional Symbols Map • Also referred to as “graduated symbol maps” • Shows more detail as symbols shows proportional size to counts it represents • Represents larger groups, not individuals
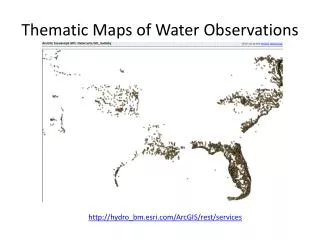
Thematic Mapping:Rates & Densities • Rates can be mapped to show proportional relationship of 2 counts (use of pie charts, bar charts etc.) • Densities are mapped to show relationship of data to geographic area (i.e. – no symbols) (use of choropleth, or “graduated color”, mapping)
Obtaining Thematic Maps • For this project you will need 3 thematic maps. • You must have at least one from American Community Survey and one Decennial Survey Map
Obtaining a Decennial Map • Go to http://factfinder.census.gov • On the main page in the center column under “Getting detailed data” go to Decennial Census, and click “get data”.
Obtaining Thematic Maps • Click on the 1990 Census Tab • Make sure that 1990 Summary Tape File 1 (STF 1) - 100-Percent data is the dot selected. To the right of this click on Thematic Maps
Obtaining Thematic Maps • The list tab will be selected, and go to select a geographic type and select county. Then select your state from the box below type. Then select the county of your choice. Highlight your county and click “Next”.
Obtaining Thematic Maps • On this screen you can select any feature that you want to have a map created. • Copy this map into FrontPage
Obtaining an American Community Survey Map • Use the fact finder website. • Go to “Fast Access to Information” type in your name of the county and the state it is located.
Obtaining an American Community Survey Map • Click on the “2000” tab. • Here you can choose any of the statistics that have map next to it. • Choose your statistic and click “map”. • Copy this map into FrontPage.
Summary • Thematic maps accent a particular geographic attribute or relationships between several attributes • Symbols on maps are varied in color, size, and shape to further accentuate spatial patterns.
Summary • For this Project you need at least one of each map. (ACS or Decennial) • For an example of what the project looks like go to • http://www.geog.psu.edu/courses/geog121/projects/proj5_example.html
E-mail • asy120@psu.edu • wrh128@psu.edu
Works Cited • DiBiase, David (2002) Understanding Geographic Data. Module 6: Census Data. ESRI Virtual Campus http://campus.esri.com Accessed 30 November 2006. • United States Bureau of the Census (2002) American FactFinder. http://factfinder.census.gov Accessed 30 November 2006.