Download
1 / 13
160 likes | 531 Views
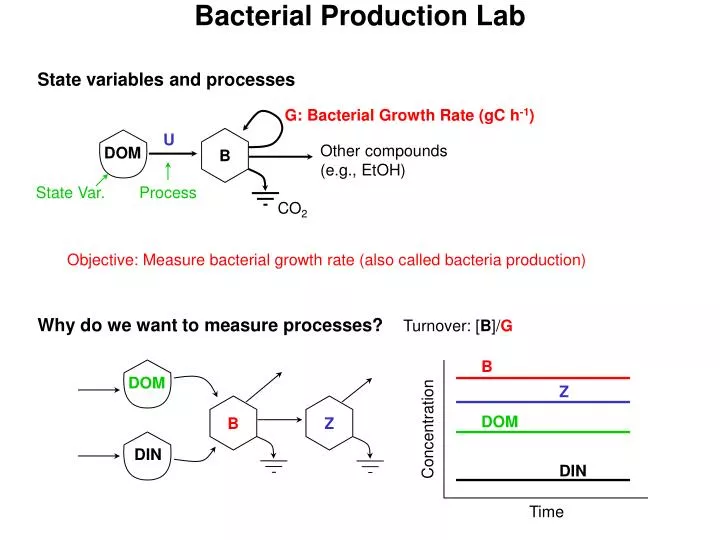
Bacterial Production Lab. State variables and processes. G: Bacterial Growth Rate (gC h -1 ). U. B. Other compounds (e.g., EtOH). DOM. State Var. Process. CO 2. Objective: Measure bacterial growth rate (also called bacteria production). Why do we want to measure processes?.

E N D
Bacterial Production Lab State variables and processes G: Bacterial Growth Rate (gC h-1) U B Other compounds (e.g., EtOH) DOM State Var. Process CO2 Objective: Measure bacterial growth rate (also called bacteria production) Why do we want to measure processes? Turnover: [B]/G B DOM Z B Z DOM Concentration DIN DIN Time
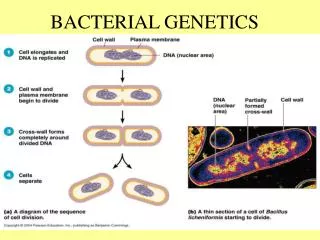
Growth Equations td Where: td Doubling time of population. x(t) Number or mass of cells per unit volume at time t. Note, cell mass or numbers are easily converted if we assume cells are all the same size: x(t) = n(t), where is the mass per cell and n is the number of cells per unit volume and x(t) is the mass of cells per unit volume. • Specific growth rate, • Take derivative of above equation with respect to time. Specific growth rate Doubling rate Recall:
How are growth rates measured? Accumulation or Loss Rates Isolate bacteria (How?), then measure: G O2 B CO2 What is main problem with this technique? Use a Tracer • Tracer Requirements • Should not change environment • Not preferentially consumed. • Bacteria must utilize for growth • Must be able to measure at low concentrations. Low detection limits reduce incubation times. • Need some measure of f G B Z DOM CO2 where GB is the rate of “blue” accumulation and f is the fraction of DOM that is labeled “blue”.
Radio-isotope Tracers Radionuclides typically used in biology: Half LifeType Tritium (3H) 12.26 y Carbon-14 (14C) 5730 y Sulfur-35 (35S) 87.2 d Chlorine-36 (36Cl) 300,000 y Phosphorus-32 (32P) 14.3 d Iodine-131 (131I) 8.06 d , Iodine-125 (125I) 60 d Types Helium nuclei Electron Gamma ray For bacterial production, 3H and 14C used. Note, 3H and 14C are weak emitters, so shielding is not required. • Units: Curie, Ci: 2.2 1012 disintegrations per min (DPM) • Becquerel: 1 DPS = 60 DPM • Specific activity (SA): Ci mmol-1 • Concentration: Ci ml-1 • Radioactivity measurements: • Geiger counter • Scintillation counter (method we will use) • Measurements are given in counts per min. (CPM) • Due to some losses, CPM < DPM Levels of detection SA: 371 mCi (mmol 14C)-1 Measure: 10 CPM~10 DPM Conc: 1 10-14 mol 10 fmol Annual Limit on 14C Ingestion: 2 mCi
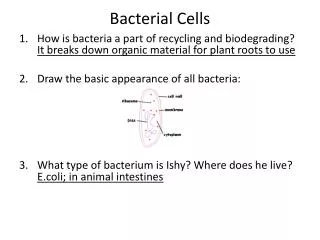
CO2 Glucose DOM CO2 Starch Glucose Glucose B B B Can’t 14C-label all DOM, so label only certain compounds What Compounds to Label? Glucose? 1000 CMP 6000 CPM B Glucose 5000 CMP Can measure growth efficiency if CO2 is captured. CO2 What fraction of the bacterial cell is produced from glucose? Problem: it is difficult to know what fraction of bacterial synthesis comes from glucose. Label macromolecules instead using appropriate monomer: Monomer % CDW Protein Amino Acids 55.0 RNA A, G, C, U 20.5 DNA A, G, C, T 3.1 Cultured E. coli
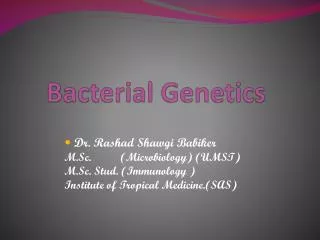
Glucose LeuI Biosyn. LeuExt Use 14C-leucine to measure the rate of bacterial protein synthesis. Calculate bacterial production rate using the following “pseudo constants”: Bacterial Production from 14C-Leucine Uptake • Pseudo constants: • Leucine content in protein 7.3 mol % • Protein Ave MW 131.9 • Protein 63 % CDW • Cell dry weight (CDW) 54 % Carbon • Isotope Dilution Problem • Occurs when radioisotope is mixed with non-radioisotope. • Extracellular • Caused by presence of Leu in solution. • Leu Concentration is small (< 1 nM), so add >10 nM Leu and ignore extracellular dilution. • Intracellular • Caused by de novo Leu synthesis. • Assume negligible, or measure.
Assessing Isotope Dilution • Extracellular dilution: • Measure background leucine concentration. • Construct kinetic curve (top right fig). • Construct time course curve (bottom left fig). • Intracellular dilution: • Measure Sp. activity of Leu in protein. • Measure actual protein synthesis rate and compare isotope-measured value. • Often, intracellular dilution is assumed not to be significant. 2 1.5 1 Leucine Incorporated 0.5 0 0 20 40 60 80 Incubation time (min)
Example Calculations Experimental Setup SA Leu: 100 Ci mmol-1 Incubations: 15 and 30 min Volume 1.5 ml Measure activity after incubation 20,657 DPM (from slope) Note, CPM ≠ DPM
Notes • Similar procedure can be done using thymidine incorporation into DNA. • Centrifugation plus rinsing (or filtration plus washing) is used to separate added Leu from bacterial incorporated Leu. • A killed control is run under identical conditions to account for abiotic adsorption of Leu onto particulate matter. • Isotope dilution due to extracellular matrix may not be insignificant in eutrophic environments. • Conversion factors are dependent on cellular conditions, and values reported are controversial. Often, only Leu incorporation is reported (i.e., not converted into cell biomass).
Plum Island Estuary Land Use Change Sea Level Rise
Example: Isotope Dilution Byron Crump
Example: Plum Island Estuary Survey (Byron Crump)