Download
1 / 26
270 likes | 673 Views
The study about subway traffic . Executive summary prepared by OR for Beta Cons and Euromedia. Summary. The context and the objectives of the research …………………………………………3 Commercials: attitudes and awareness ........................................................ . ............ 11

E N D
The study about subway traffic Executive summary prepared by OR for Beta Cons and Euromedia
Summary • The context and the objectives of the research …………………………………………3 • Commercials: attitudes and awareness.....................................................................11 • General profile of the subway user………...................................................................16 • Subway – types of consumer .......................................................................................21 • Audience indicators ....................................................................................................23
The context and the research objectives • Romanian media and advertising market knows an accelerated development from the investments points of view as well as people professionalism and involved companies. • Although for the Romanian outdoor market does not exist a systematic instrument and a measurement objective of the outdoor advertising impact and efficiency. • Thus, in June-August 2006, Operations Research has realize a research to measure the advertising impact for the subway. • The research had two principal aims: • Obtaining the information concerning the performance of the advertising impact function of location, socio-demographics characteristics and contexts. • The construction of performance indicators of the exposure to advertising medium (GRP, Reach, Frequency, stations profiles/socio-demographics indicators) compatible with those already used for planning and the evolution of advertising campaigns on others media supports: print, radio, TV. • It was desired to offer to the local advertising markets a performance information, compatible with the rest of the media markets, to use as an evolution points in the relation with the clients and agencies.
4 2 3 5 6 1 The research stages The methodology guided by the question: What type of audience indicators we want? Representative panel for the Bucharest Panel subway users Panel refresh (trimestrial) GRP REACH Underpanel representative subway users
Methodology and sample WHAT?Quantitative research PANELWe started from a larger panel, representative for all Bucharest population, of 2,000 persons. The panel has been aleators stratified multistage, stratified according to field distribution and with the fallowing selection stage: street (selection from the Bucharest stree list), household (aleators, according with the initial number, according to selection step, according to the random method route), person (aleators according to the most near birthday). For the panel, the sample consisted in 431 persons ANALYSIS Uni and multi variated analysis. Both samples have been balanced. Panel’s share have been the ones obtained from the total sample. WHERE?Bucharest WHEN?12 July – 8 August
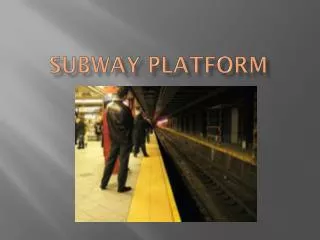
The use of subway % Bucharest citizens Bucharest citizens Base: n=2000 Base: N=1,719,100 Use subway Use subway Yes Yes • For all sample, 23% or 403,600 Bucharest citizens declared that they use subway frequently 403,600 23% 12% • From the ones that use subway more than half (60% - 250,000 Bucharest citizens) are constant users – probability for high exposure Base: N=1,719,100 Baza: n=486
Subway use - reasons Principalul motiv – o singura mentiune • The most frequent reasons to use the subway refer to work and visits – half of the one that answered mentioned this reasons. • 1 of ten Bucharest citizens use the subway to go to work. This is the main reason for the use of the subway. The reasons of subway use – multiple choice (%) Baza: % utilizatori metrou
Number of rides for a day • Half of the subway users take 2 rides for a day
Number of station used in one month • 1 of 4 subway‘s user use in a month only 2 station. Interpretation: for Reach, one campaign must have a large variety of subway stations. For GRP must be used station with a high number of passengers.
Subway use – activities during waiting process Dedicated activities – one mention • Two types of main activities described by the participants are: waiting in the same place (66%) and walking on the platform (31%) • There is an agreement in the data from te observation (platform), and sample (households) Noticed activities - main activity (alternative methodology: subway surveys) Base: % subway users
Advertising panels - impact (%) How often do yow look at the advertising panels in the subway….. • More than half of the subway users (59%) look at the panels often/ always • Only 15% of the subway users declare that they look at the panes rarely or never.
Awareness subway commercials • A number of 12 Ads (presented in the subway stations during the study were tested.) For each commercial the respondents were asked wich was the location/station (an answer was considered correct only if the location was correctly identified). • 58% of the respondents mentioned spontaneously one of the 12 Ads, recognizing correctly the location and almost half (42%) recognized at least one AD. % Assisted (Reproduction) Spontaneously (Reproduction) • 25% of the subway users did not recognized any of the tested Ads (interpretation: for a hypothetical campaign having the respective combination of panels, reach 1+ is 76%/ 307,000 Bucharest citizens had seen at least one time the commercial; the same, 121,000 have been exposed 3 or 4 times)
Attitude for the subway commercials • Almost half of the subway users (44% - composite value) have a positive attitude for the commercials, and only 1 of 5 users have a neutral attitude or hostile. • The benefits associated with the commercials are “entertainment ” type – 1 of 3 respondents totally agree that the subway commercials chase monotony. • Interpretation: The intense positive attitude for the commercials is the result of the target profile and context. Total agrreement 61% 60% 60% 57% 29% 12% * Described in another chpater Total disagreement
Subway – general profile of the users (% users) Age Sex Education Educated population: more than half have medium studies and 1 of 4 have superior studies. Almost half of the subway users are adults and young adults Women and men
Subway user profile Income Household position Job A few categories of jobs stand in front: pensioner, non – manually ocupation and students. Almost half (38%) are the ones who shop or take the shopping decisions. Approximate 1 of 3 subway users are the ones who bring the most money in the household. Often medium income and high income. Half of the respondent have a medium or high income Even if 1 of 4 persons that take the subway are pensioners - less than 6% from the total rides with the subway are made by these (data presented in the next chapter )
Subway use – use intensity • Interpretation: persons that have a high affinity (use subway with a higher intensity, having a higher pshare in GRP ) are women as well as men, teenagers, and medium income. • Use: subway reaches a specific target (described above). To maximize some profiles the graphic will be replied on the important stations. Nota metodologica: procentele sunt calculate ca si consum metrou (nr. calatorii ) / utilizatori metrou (profil sociodemografic)
Rides in a month (GRP) • Interpretation: From the point of view of the travellers (GRP), cumulated, the biggest subway stations (Unirii, Universitate, Grigorascu, Victoriei Romana) attract approximately 500.000 visits/ month. M1 M2 M3 M4 Pasaj
Persons in a month (Reach) • Interpretation: From the points of view of the persons (cumulated Reach) the biggest stations are Unirii 2 (8% from the total of Bucharest citizens 14+ passed through a station during a month), fallowed by Universitatii (7% from the total of Bucharest citizens 14+ M1 M2 M3 M4 Pasaj
Monthly use frequently • Interpretation: The station with a high fidelity are Nicolae Grigorescu, Gorjului, Piata Iancului si Pasaj Eroilor. They are stations with a GRP less than the average, but with a repeated exposure of the message to the same persons. M1 M2 M3 M4 Pasaj
Monthly use frequently • There are 5 types of stations: • Unirii, Universitate: stations that have GRP and Reach over given (>300%) • Piata Romana → Aviatorilor : stations that have GRP and Reach above average (250-130%) • Crangasi →Dristor 2: stations that have GRP and Reach around average(130-80%) • Titan → Aurel Vlaicu : stations that have GRP and Reach under average (130-80%) • Politehica → Dristor Pasaj : stations that have GRP and Reach less than the medium (sub 40%) average 100%
Emil Pîslaru – Research Director emil@operationsresearch.ro mirela@operationsresearch.ro Mirela Apostol – Client service Director 24 Transilvaniei Street Ground Floor 1st sectorBucharest - Romania www.operationsresearch.ro Thank you!