Download
1 / 12
120 likes | 201 Views
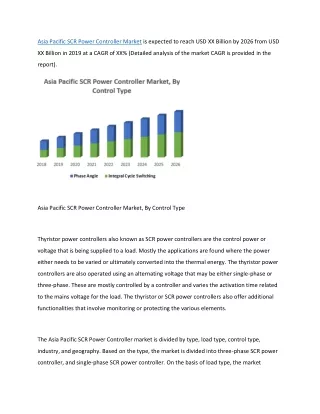
Global Power Transmission Towers and Cables Market stood at US$7.62 billion in 2014 and is likely to reach US$13.90 billion by 2023, expanding at a CAGR of 7.15% between 2015 and 2023.<br><br>Transparency Market Research has published a new research report titled “Power Transmission Towers and Cables Market - Global Industry Analysis, Size, Share, Growth Trends and Forecast 2015 – 2023” to their report store.

E N D
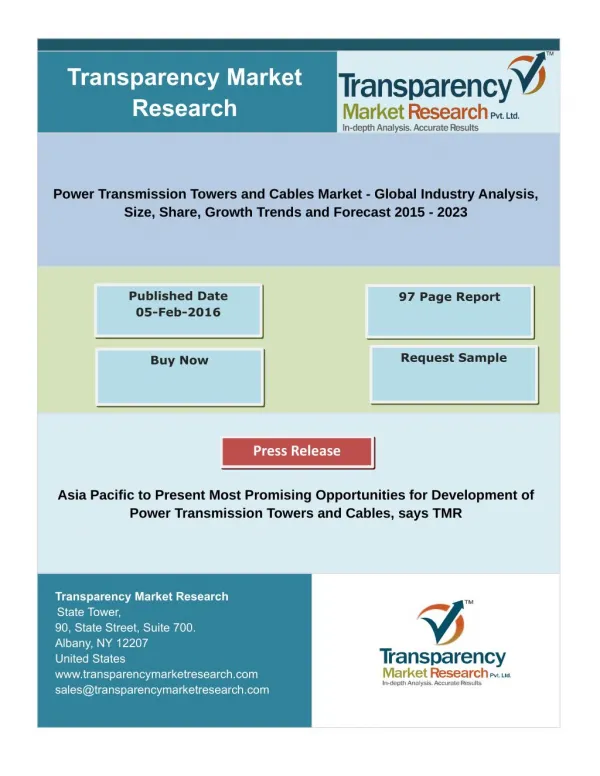
Transparency Market Research Power Transmission Towers and Cables Market - Global Industry Analysis, Size, Share, Growth Trends and Forecast 2015 - 2023 Published Date 05-Feb-2015 97 Page Report Buy Now Request Sample Press Release Asia Pacific to Present Most Promising Opportunities for Development of Power Transmission Towers and Cables: TMR Transparency Market Research State Tower, 90, State Street, Suite 700. Albany, NY 12207 United States www.transparencymarketresearch.com sales@transparencymarketresearch.com
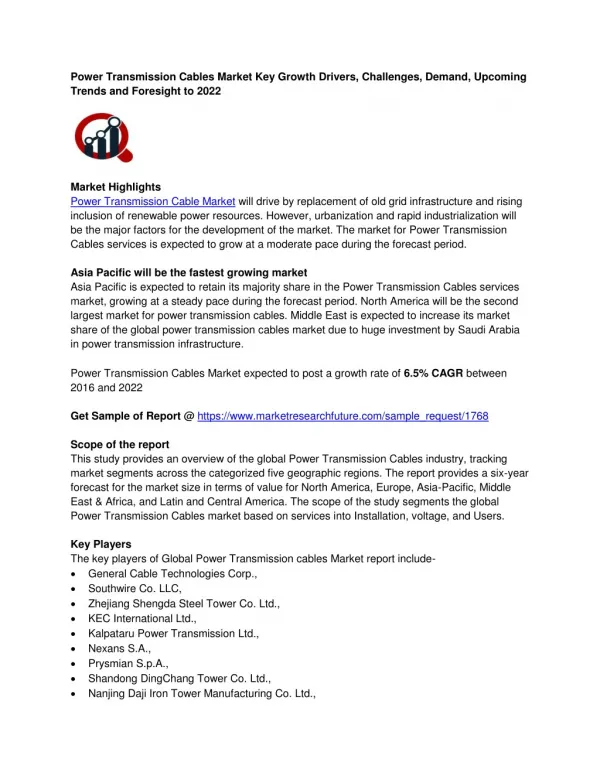
Power Transmission Towers an Cables Market REPORT DESCRIPTION Power Transmission Towers and Cables Market - Global Industry Analysis, Size, Share, Growth Trends and Forecast 2015 - 2023 The increasingly dynamic operating environment with the integration of renewable and distributed power resources in conventional grid infrastructure will have a major impact on the future development of the global power transmission towers and cables market, states a recent report by Transparency Market Research (TMR). The vast number of companies operating in the highly fragmented marketplace will benefit from the rising demand for up gradation of old or technologically outdated grid infrastructures. Asia Pacific is home to some of the largest vendors in the power transmission towers and cables market, including Sumitomo Electric Industries Ltd., KEC International Ltd., Shandong Ding hang Tower Co. Ltd., Nanjing Daji Iron Tower Manufacturing Co. Ltd., Zhejiang Shengda Steel Tower Co. Ltd., and Kalpataru Power Transmission Ltd. Browse The Full Report @: http://www.transparencymarketresearch.com/power-transmission-towers-cables-market.html Mounting Demand for Electricity to Lead to Expansion of Grid Networks Uninterrupted and high quality electricity supply being central to several developments in today’s increasingly digitized world, the vast rise in the global demand for electricity forms the backbone of the global power transmission towers and cables market. In addition to this factor, rapid industrialization and urbanization will be the major factors encouraging developments in the market in the next few years. The need to adapt to the dynamically changing grid infrastructures, owing to the rising integration of renewable power sources in conventional grids, and dynamically changing load profiles will lead to technological advancements in the sector. The market will also witness significant development in response to the need for upgrading grid elements to technologically advanced ones, demand for which is driven by the increasing complexity of transmission networks and the constant rise in power flow. 2 Transparency Market Research
Power Transmission Towers an Cables Market However, the market will be hampered to a certain extent owing to the emergence of wireless power transmission technologies such as laser beaming and solar and magnetic resonant induction coupling in the next few years. Known to minimize electrical energy losses and grant increased convenience of energy transfer, these technologies will see increased adoption from utilities looking for ways of achieving increased power efficiency. Adoption of these technologies will, to an extent, limit the need for overhead cables and above-ground power transmission towers. Get the PDF Brochure for more Professional and Technical industry insights @: http://www.transparencymarketresearch.com/sample/sample.php?flag=S&rep_id=8965 Urgency for Grid Up-gradation in Emerging Countries to be Key Enabler of Growth The markets for power transmission towers and cables in developed regions will be driven majorly by the vast and rapid changes in power flows and operating environment associated with the rising inclusion of renewable and distributed power resources in grid infrastructure. Additionally, the aging of grid components in these regions will also be a major driver of the power transmission towers and cables market. In developing regions such as Asia Pacific and Africa, limitations in existing grid infrastructure will lead to the increased demand for technologically advanced power transmission towers. Existing products in grid infrastructure in these regions, including circuit breakers, fixed shunt reactors, and conventional transformers, will not be able to deal with situations such as higher power and quality demands of modern digital devices, load variability, and increasingly complex and long interconnections. Thus, power transmission towers will be subjected to numerous changes in regards with design, control mechanism, and safety and security features in the near future, driving increased demand for tower maintenance and up-gradation services. Asia Pacific will account for the largest share in the global market for power transmission towers and cables in terms of both volume and revenue generation, with nearly 44% and 49%, respectively, in the global market by 2023. Transparency Market Research projects that the global market for power transmission towers and cables will tread along a healthy growth path over the next few years. Expected to exhibit a CAGR of 7.15% over the period between 2015 and 2023, the market will rise from a valuation of US$7.62 bn in 2014 to US$13.90 bn by 2023. 3 Transparency Market Research
Power Transmission Towers an Cables Market This review of the market is based on a recent market research report published by Transparency Market Research, titled “Power Transmission Towers and Cables Market - Global Industry Analysis, Size, Share, Growth Trends and Forecast 2015 - 2023.” Browse Press Release: http://www.transparencymarketresearch.com/pressrelease/power-transmission-towers-cables- market.htm TABLE OF CONTENT Section 1 Preface Report Description Market Segmentation Research Scope Research Methodology Section 2 Executive Summary Global Power Transmission Towers and Cables Market Estimates and Forecasts Overview Section 3 Industry Analysis Introduction Value Chain Analysis of Power Transmission Towers and Cables Market Market Dynamics oDriver 1 – Increasing demand for electricity oDriver 2 – Growing need for replacement of ageing power transmission infrastructure oDriver 3 – Increasing share of renewable energy sources in total power generation mix oRestraint 1 – High initial capital and installation costs oOpportunity 1 – Increasing adoption of newer technologies in power transmission infrastructure Porter’s Five Forces Analysis oBargaining power of suppliers oBargaining power of buyers oThreat of new entrants oDegree of competition oThreat of substitutes 4 Transparency Market Research
Power Transmission Towers an Cables Market Market Attractiveness Analysis of Power Transmission Towers and Cables Market, 2014 Section 4 Power Transmission Towers and Cables: Type Overview Global Power Transmission Towers and Cables Market, Revenue Share by Type Segment, 2014 and 2023 Global Power Transmission Towers and Cables Market Estimates and Forecast, By Region, 2014–2023 (Units) (Kms) Global Power Transmission Towers and Cables Estimates and Forecast, By Region, 2014–2023 (US$ Mn) Power Transmission Towers: Overview oGlobal Power Transmission Towers Market Estimates and Forecast, 2014–2023 (Units) oGlobal Power Transmission Towers Market Estimates and Forecast, 2014–2023 (US$ Mn) Power Transmission Cables: Overview oGlobal Power Transmission Cables Market Estimates and Forecast, 2014–2023 (Kms) oGlobal Power Transmission Cables Market Estimates and Forecast, 2014–2023 (US$ Mn) Section 5 Power Transmission Towers and Cables: Regional Overview Power Transmission Towers and Cables – North America oPower Transmission Towers and Cables Market – North America, 2014 to 2023 (Units) (Kms) (US$ Mn) oU.S. Power Transmission Towers and Cables Market, 2014 to 2023 (US$ Mn) oU.S. Power Transmission Towers and Cables Market, By Type, 2014 to 2023 (Units) (Kms) oCanada Power Transmission Towers and Cables Market, 2014 to 2023 (US$ Mn) oCanada Power Transmission Towers and Cables Market, By Type, 2014 to 2023 (Units) (Kms) oMexico Power Transmission Towers and Cables Market, 2014 to 2023 (US$ Mn) oMexico Power Transmission Towers and Cables Market, By Type, 2014 to 2023 (Units) (Kms) Power Transmission Towers and Cables – Europe oPower Transmission Towers and Cables Market – Europe, 2014 to 2023 (Units) (Kms) (US$ Mn) oCIS Power Transmission Towers and Cables Market, 2014 to 2023 (US$ Mn) oCIS Power Transmission Towers and Cables Market, By Type, 2014 to 2023 (Units) (Kms) oGermany Power Transmission Towers and Cables Market, 2014 to 2023 (US$ Mn) oGermany Power Transmission Towers and Cables Market, By Type, 2014 to 2023 (Units) (Kms) oU.K Power Transmission Towers and Cables Market, 2014 to 2023 (US$ Mn) oU.K Power Transmission Towers and Cables Market, By Type, 2014 to 2023 (Units) (Kms) oRest of Europe Power Transmission Towers and Cables Market, 2014 to 2023 (US$ Mn) 5 Transparency Market Research
Power Transmission Towers an Cables Market oRest of Europe Power Transmission Towers and Cables Market, By Type, 2014 to 2023 (Units) (Kms) Power Transmission Towers and Cables – Asia Pacific oPower Transmission Towers and Cables Market – Asia Pacific, 2014 to 2023 (Units) (Kms) (US$ Mn) oChina Power Transmission Towers and Cables Market, 2014 to 2023 (US$ Mn) oChina Power Transmission Towers and Cables Market, By Type, 2014 to 2023 (Units) (Kms) oIndia Power Transmission Towers and Cables Market, 2014 to 2023 (US$ Mn) oIndia Power Transmission Towers and Cables Market, By Type, 2014 to 2023 (Units) (Kms) oRest of Asia Pacific Power Transmission Towers and Cables Market, 2014 to 2023 (US$ Mn) oRest of Asia Pacific Power Transmission Towers and Cables Market, By Type, 2014 to 2023 (Units) (Kms) Power Transmission Towers and Cables – Middle East and Africa oPower Transmission Towers and Cables Market – Middle East and Africa, 2014 to 2023 (Units) (Kms) (US$ Mn) oSaudi Arabia Power Transmission Towers and Cables Market, 2014 to 2023 (US$ Mn) oSaudi Arabia Power Transmission Towers and Cables Market, By Type, 2014 to 2023 (Units) (Kms) oSouth Africa Power Transmission Towers and Cables Market, 2014 to 2023 (US$ Mn) oSouth Africa Power Transmission Towers and Cables Market, By Type, 2014 to 2023 (Units) (Kms) oRest of Middle East and Africa Power Transmission Towers and Cables Market, 2014 to 2023 (US$ Mn) oRest of Middle East and Africa Power Transmission Towers and Cables Market, By Type, 2014 to 2023 (Units) (Kms) oPower Transmission Towers and Cables – Latin and Central Americas Power Transmission Towers and Cables Market – Latin and Central Americas, 2014 to 2023 (Units) (Kms) (US$ Mn) oBrazil Power Transmission Towers and Cables Market, 2014 to 2023 (US$ Mn) oBrazil Power Transmission Towers and Cables Market, By Type, 2014 to 2023 (Units) (Kms) oArgentina Power Transmission Towers and Cables Market, 2014 to 2023 (US$ Mn) oArgentina Power Transmission Towers and Cables Market, By Type, 2014 to 2023 (Units) (Kms) oRest of Latin and Central Americas Power Transmission Towers and Cables Market, 2014 to 2023 (US$ Mn) oRest of Latin and Central Americas Power Transmission Towers and Cables Market, By Type, 2014 to 2023 (Units) (Kms) 6 Transparency Market Research
Power Transmission Towers an Cables Market Section 6 Company Profiles Kalpataru Power Transmission Ltd. Zhejiang Shengda Steel Tower Co. Ltd. Nanjing Daji Iron Tower Manufacturing Co. Ltd. ShanDong DingChang Tower Co. Ltd. KEC International Ltd. Prysmian S.p.A. Nexans S.A. General Cable Technologies Corporation Sumitomo Electric Industries Ltd. Southwire Company LLC List of Figures Figure 1 Global Power Transmission Towers and Cables Market, Estimates and Forecast, 2014–2023 (US$ Mn) Figure 2 Global Electricity Consumption, By Volume, 2007–2014 (TWh) Figure 3 Market Attractiveness Analysis of Power Transmission Towers and Cables Market, 2014 Figure 4 Global Electricity Generation, By Fuel Type, 2005 Figure 5 Global Power Transmission Towers and Cables, Market Share by Type Segment, 2014 Figure 6 Global Power Transmission Towers and Cables, Market Share by Type Segment, 2023 Figure 7 Global Power Transmission Towers Market, Estimates and Forecasts, By Revenue, 2014–2023 (US$ Mn) Figure 8 Global Power Transmission Towers Market, Estimates and Forecasts, By Volume, 2014–2023 (Units) Figure 9 Global Power Transmission Cables Market, Estimates and Forecasts, By Revenue, 2014–2023 (US$ Mn) Figure 10 Global Power Transmission Cables Market, Estimates and Forecasts, By Volume, 2014–2023 (Kms) Figure 11 U.S. Power Transmission Towers Market, Estimates and Forecasts, By Volume, 2014–2023 (Units) Figure 12 U.S. Power Transmission Towers Market, Estimates and Forecasts, By Revenue, 2014–2023 (US$ Mn) Figure 13 U.S. Power Transmission Cables Market, Estimates and Forecasts, By Volume, 2014–2023 (Kms) Figure 14 U.S. Power Transmission Cables Market, Estimates and Forecasts, By Revenue, 2014–2023 (US$ Mn) Figure 15 Canada Power Transmission Towers Market, Estimates and Forecasts, By Volume, 2014–2023 7 Transparency Market Research
Power Transmission Towers an Cables Market (Units) Figure 16 Canada Power Transmission Towers Market, Estimates and Forecasts, By Revenue, 2014–2023 (US$ Mn) Figure 17 Canada Power Transmission Cables Market, Estimates and Forecasts, By Volume, 2014–2023 (Kms) Figure 18 Canada Power Transmission Cables Market, Estimates and Forecasts, By Revenue, 2014–2023 (US$ Mn) Figure 19 Mexico Power Transmission Towers Market, Estimates and Forecasts, By Volume, 2014–2023 (Units) Figure 20 Mexico Power Transmission Towers Market, Estimates and Forecasts, By Revenue, 2014–2023 (US$ Mn) Figure 21 Mexico Power Transmission Cables Market, Estimates and Forecasts, By Volume, 2014–2023 (Kms) Figure 22 Mexico Power Transmission Cables Market, Estimates and Forecasts, By Revenue, 2014–2023 (US$ Mn) Figure 23 CIS Power Transmission Towers Market, Estimates and Forecasts, By Volume, 2014–2023 (Units) Figure 24 CIS Power Transmission Towers Market, Estimates and Forecasts, By Revenue, 2014–2023 (US$ Mn) Figure 25 CIS Power Transmission Cables Market, Estimates and Forecasts, By Volume, 2014–2023 (Kms) Figure 26 CIS Power Transmission Cables Market, Estimates and Forecasts, By Revenue, 2014–2023 (US$ Mn) Figure 27 Germany Power Transmission Towers Market, Estimates and Forecasts, By Volume, 2014–2023 (Units) Figure 28 Germany Power Transmission Towers Market, Estimates and Forecasts, By Revenue, 2014–2023 (US$ Mn) Figure 29 Germany Power Transmission Cables Market, Estimates and Forecasts, By Volume, 2014–2023 (Kms) Figure 30 Germany Power Transmission Cables Market, Estimates and Forecasts, By Revenue, 2014–2023 (US$ Mn) Figure 31 U.K Power Transmission Towers Market, Estimates and Forecasts, By Volume, 2014–2023 (Units) Figure 32 U.K Power Transmission Towers Market, Estimates and Forecasts, By Revenue, 2014–2023 (US$ Mn) Figure 33 U.K Power Transmission Cables Market, Estimates and Forecasts, By Volume, 2014–2023 (Kms) 8 Transparency Market Research
Power Transmission Towers an Cables Market Figure 34 U.K Power Transmission Cables Market, Estimates and Forecasts, By Revenue, 2014–2023 (US$ Mn) Figure 35 Rest of Europe Power Transmission Towers Market, Estimates and Forecasts, By Volume, 2014– 2023 (Units) Figure 36 Rest of Europe Power Transmission Towers Market, Estimates and Forecasts, By Revenue, 2014– 2023 (US$ Mn) Figure 37 Rest of Europe Power Transmission Cables Market, Estimates and Forecasts, By Volume, 2014– 2023 (Kms) Figure 38 Rest of Europe Power Transmission Cables Market, Estimates and Forecasts, By Revenue, 2014– 2023 (US$ Mn) Figure 39 China Power Transmission Towers Market, Estimates and Forecasts, By Volume, 2014–2023 (Units) Figure 40 China Power Transmission Towers Market, Estimates and Forecasts, By Revenue, 2014–2023 (US$ Mn) Figure 41 China Power Transmission Cables Market, Estimates and Forecasts, By Volume, 2014–2023 (Kms) Figure 42 China Power Transmission Cables Market, Estimates and Forecasts, By Revenue, 2014–2023 (US$ Mn) Figure 43 India Power Transmission Towers Market, Estimates and Forecasts, By Volume, 2014–2023 (Units) Figure 44 India Power Transmission Towers Market, Estimates and Forecasts, By Revenue, 2014–2023 (US$ Mn) Figure 45 India Power Transmission Cables Market, Estimates and Forecasts, By Volume, 2014–2023 (Kms) Figure 46 India Power Transmission Cables Market, Estimates and Forecasts, By Revenue, 2014–2023 (US$ Mn) Figure 47 Rest of Asia Pacific Power Transmission Towers Market, Estimates and Forecasts, By Volume, 2014–2023 (Units) Figure 48 Rest of Asia Pacific Power Transmission Towers Market, Estimates and Forecasts, By Revenue, 2014–2023 (US$ Mn) Figure 49 Rest of Asia Pacific Power Transmission Cables Market, Estimates and Forecasts, By Volume, 2014–2023 (Kms) Figure 50 Rest of Asia Pacific Power Transmission Cables Market, Estimates and Forecasts, By Revenue, 2014–2023 (US$ Mn) Figure 51 Saudi Arabia Power Transmission Towers Market, Estimates and Forecasts, By Volume, 2014–2023 (Units) Figure 52 Saudi Arabia Power Transmission Towers Market, Estimates and Forecasts, By Revenue, 2014– 9 Transparency Market Research
Power Transmission Towers an Cables Market 2023 (US$ Mn) Figure 53 Saudi Arabia Power Transmission Cables Market, Estimates and Forecasts, By Volume, 2014–2023 (Kms) Figure 54 Saudi Arabia Power Transmission Cables Market, Estimates and Forecasts, By Revenue, 2014– 2023 (US$ Mn) Figure 55 South Africa Power Transmission Towers Market, Estimates and Forecasts, By Volume, 2014–2023 (Units) Figure 56 South Africa Power Transmission Towers Market, Estimates and Forecasts, By Revenue, 2014– 2023 (US$ Mn) Figure 57 South Africa Power Transmission Cables Market, Estimates and Forecasts, By Volume, 2014–2023 (Kms) Figure 58 South Africa Power Transmission Cables Market, Estimates and Forecasts, By Revenue, 2014– 2023 (US$ Mn) Figure 59 Rest of Middle East and Africa Power Transmission Towers Market, Estimates and Forecasts, By Volume, 2014–2023 (Units) Figure 60 Rest of Middle East and Africa Power Transmission Towers Market, Estimates and Forecasts, By Revenue, 2014–2023 (US$ Mn) Figure 61 Rest of Middle East and Africa Power Transmission Cables Market, Estimates and Forecasts, By Volume, 2014–2023 (Kms) Figure 62 Rest of Middle East and Africa Power Transmission Cables Market, Estimates and Forecasts, By Revenue, 2014–2023 (US$ Mn) Figure 63 Brazil Power Transmission Towers Market, Estimates and Forecasts, By Volume, 2014–2023 (Units) Figure 64 Brazil Power Transmission Towers Market, Estimates and Forecasts, By Revenue, 2014–2023 (US$ Mn) Figure 65 Brazil Power Transmission Cables Market, Estimates and Forecasts, By Volume, 2014–2023 (Kms) Figure 66 Brazil Power Transmission Cables Market, Estimates and Forecasts, By Revenue, 2014–2023 (US$ Mn) Figure 67 Argentina Power Transmission Towers Market, Estimates and Forecasts, By Volume, 2014–2023 (Units) Figure 68 Argentina Transmission Towers Market, Estimates and Forecasts, By Revenue, 2014–2023 (US$ Mn) Figure 69 Argentina Power Transmission Cables Market, Estimates and Forecasts, By Volume, 2014–2023 (Kms) 10 Transparency Market Research
Power Transmission Towers an Cables Market Figure 70 Argentina Power Transmission Cables Market, Estimates and Forecasts, By Revenue, 2014–2023 (US$ Mn) Figure 71 Rest of Latin and Central Americas Power Transmission Towers Market, Estimates and Forecasts, By Volume, 2014–2023 (Units) Figure 72 Rest of Latin and Central Americas Transmission Towers Market, Estimates and Forecasts, By Revenue, 2014–2023 (US$ Mn) Figure 73 Rest of Latin and Central Americas Power Transmission Cables Market, Estimates and Forecasts, By Volume, 2014–2023 (Kms) Figure 74 Rest of Latin and Central Americas Power Transmission Cables Market, Estimates and Forecasts, By Revenue, 2014–2023 (US$ Mn) List of Tables Table 1 Global Natural Gas Storage Market (Revenue): Snapshot Table 2 Global Natural Gas Storage Market (Volume): Snapshot Table 3 Global Power Transmission Towers Market, Estimates and Forecasts, By Region, 2014–2023 (US$ Mn) Table 4 Global Power Transmission Towers Market, Estimates and Forecasts, By Region, 2014–2023 (Units) Table 5 Global Power Transmission Cables Market, Estimates and Forecasts, By Region, 2014–2023 (US$ Mn) Table 6 Global Power Transmission Cables Market, Estimates and Forecasts, By Region, 2014–2023 (Kms) Browse All Energy Market Research Reports: http://www.transparencymarketresearch.com/energy-market-reports-3.html About Us Transparency Market Research (TMR) is a market intelligence company, providing global business information reports and services. Our exclusive blend of quantitative forecasting and trends analysis provides forward-looking insight for thousands of decision makers. TMR’s experienced team of analysts, researchers, and consultants, use proprietary data sources and various tools and techniques to gather, and analyze information. Our business offerings represent the latest and the most reliable information indispensable for businesses to sustain a competitive edge. 11 Transparency Market Research
Power Transmission Towers an Cables Market Each TMR syndicated research report covers a different sector - such as pharmaceuticals, chemicals, energy, food & beverages, semiconductors, med-devices, consumer goods and technology. These reports provide in-depth analysis and deep segmentation to possible micro levels. With wider scope and stratified research methodology, TMR’s syndicated reports strive to provide clients to serve their overall research requirement. Contact Transparency Market Research 90 State Street, Suite 700, Albany NY - 12207 United States Tel: +1-518-618-1030 USA - Canada Toll Free 866-552-3453 Email:sales@transparencymarketresearch.com Website:http://www.transparencymarketresearch.com/ Browse The Market Research Blog: http://globalresearchmarket.blogspot.in/ 12 Transparency Market Research