Download
1 / 28

E N D
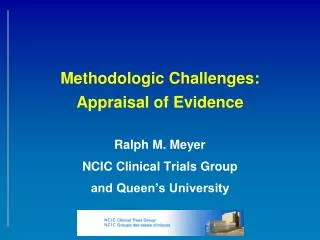
1. Critical appraisal:Randomized-controlled trials for Drug Therapy Hello and welcome to the module entitled: Critical appraisal of -- -- --. My name is Nancy Lee and I am a research fellow with the Drug Effectiveness Review Project at the Oregon Evidence-based Practice Center.
�
To receive continuing education credit you must review this section and answer the CME questions with a passing score of 75%.
�
�
�
Next slideHello and welcome to the module entitled: Critical appraisal of -- -- --. My name is Nancy Lee and I am a research fellow with the Drug Effectiveness Review Project at the Oregon Evidence-based Practice Center.
�
To receive continuing education credit you must review this section and answer the CME questions with a passing score of 75%.
�
�
�
Next slide
2. The attachments tab in the upper right had corner contains documents that supplement this presentation. Handouts of slides and a glossary of terms can be found under this tab and are available to print out for your use. The URL to online resources are also located here as well.
Next slide The attachments tab in the upper right had corner contains documents that supplement this presentation. Handouts of slides and a glossary of terms can be found under this tab and are available to print out for your use. The URL to online resources are also located here as well.
Next slide
3. This work was made possible by a grant from the state Attorney General Consumer and Prescriber Education program�which is funded by the multi-state settlement of consumer fraud claims regarding the marketing of the prescription drug Neurontin.
Next slideThis work was made possible by a grant from the state Attorney General Consumer and Prescriber Education program�which is funded by the multi-state settlement of consumer fraud claims regarding the marketing of the prescription drug Neurontin.
Next slide
4. This program has been planned and implemented in accordance with the Essential Areas and Policies of the Accreditation Council for CME jointly sponsored by the University of Texas Southwestern Medical Center and the Federation of State Medical Board�s Research and Education Foundation.
Next slideThis program has been planned and implemented in accordance with the Essential Areas and Policies of the Accreditation Council for CME jointly sponsored by the University of Texas Southwestern Medical Center and the Federation of State Medical Board�s Research and Education Foundation.
Next slide
5. CME information The course director is Barbara Schneidman, MD, MPH with the Federation of State Medical Boards Research and Education Foundation, and the
The program directors are as follows:
David Pass, MD
Director of Health Resources Commission at the Oregon Office for Health Policy and Research
Dean Haxby, PharmD
Associate professor of pharmacy practice at the Oregon State University College of Pharmacy
Daniel Hartung, PharmD, MPH
Assistant professor of pharmacy practice also at the Oregon State University College of Pharmacy
This educational activity is intended for persons who are involved in committees dealing with medication use policies and for health care professionals who are involved with medication prescribing.
The educational objectives are described below but will be reviewed in detail in the following slides.
Next slide
The course director is Barbara Schneidman, MD, MPH with the Federation of State Medical Boards Research and Education Foundation, and the
The program directors are as follows:
David Pass, MD
Director of Health Resources Commission at the Oregon Office for Health Policy and Research
Dean Haxby, PharmD
Associate professor of pharmacy practice at the Oregon State University College of Pharmacy
Daniel Hartung, PharmD, MPH
Assistant professor of pharmacy practice also at the Oregon State University College of Pharmacy
This educational activity is intended for persons who are involved in committees dealing with medication use policies and for health care professionals who are involved with medication prescribing.
The educational objectives are described below but will be reviewed in detail in the following slides.
Next slide
6. CME policies The continuing education sponsors require us to report the policies for this program which are described below.
Next slide.The continuing education sponsors require us to report the policies for this program which are described below.
Next slide.
7. Each speaker for this program has completed and signed a conflict of interest statement. The faculty members relationships to any commercial entities are listed on this slide.
Next slideEach speaker for this program has completed and signed a conflict of interest statement. The faculty members relationships to any commercial entities are listed on this slide.
Next slide
8. Learning objectives Recognize difference between overall critical appraisal of evidence and quality assessment / internal validity
What is it and why is it necessary?
Review general steps involved in critical appraisal
Discuss various components of internal validity
Review important statistical concepts important in critical appraisal
Recognize importance of clinical insight and experience in critical appraisal By the end of this module our objectives are for you to recognize the difference between critical appraisal and quality assessment or internal validity�we will define what critical appraisal entails and why it is necessary for clinicians and decision makers.
Along the way, we will be reviewing general steps involved in critical assessment of literatiure and discuss the various components of internal validity.
Then we will briefly re-review commonly reported statistical methods used in randomized trials. All the while recognizing the importance of your clinical insight and experience in these processes.
Next slideBy the end of this module our objectives are for you to recognize the difference between critical appraisal and quality assessment or internal validity�we will define what critical appraisal entails and why it is necessary for clinicians and decision makers.
Along the way, we will be reviewing general steps involved in critical assessment of literatiure and discuss the various components of internal validity.
Then we will briefly re-review commonly reported statistical methods used in randomized trials. All the while recognizing the importance of your clinical insight and experience in these processes.
Next slide
9. What is critical appraisal? Process of examining research evidence to evaluate its validity, results, and relevance before making an informed decision
It�s not an exact science and it won�t give us the �right� answers
Foundation to practicing thoughtful �evidence-based� or �evidence-informed� medicine
Hill, et al. Bandolier Volume 3 (2). http://www.evidence-based-medicine.co.uk So, what is critical appraisal?
For this module we will be defining critical appraisal as a systematic process or approach of EXAMINING research to evaluate validity of results and relevance of the trial before using the information to make informed decisions.
Critical appraisal is not an exact science and the process of critical literature evaluation does not provide us with the �right� answers let alone clear conclusions.
Using and building upon critical appraisal skills is the foundation to practicing thoughtful �evidence-based� or �evidence-informed� medicine.
Next slideSo, what is critical appraisal?
For this module we will be defining critical appraisal as a systematic process or approach of EXAMINING research to evaluate validity of results and relevance of the trial before using the information to make informed decisions.
Critical appraisal is not an exact science and the process of critical literature evaluation does not provide us with the �right� answers let alone clear conclusions.
Using and building upon critical appraisal skills is the foundation to practicing thoughtful �evidence-based� or �evidence-informed� medicine.
Next slide
10. Why is it necessary? Not all publications are equally convincing or reliable (even if published in a reputable journal).
Incorrect interpretation
Fraud and misrepresentation of results
Data dredging
Data dumping
Sometimes clinical experience and theory based on pathophysiology can be misleading.
Systematically examining the literature increases our confidence in our strengths and shed light on areas of weakness
Learning how to critically evaluate and scrutinize evidence is a good skill to develop and a necessary one to cultivate because as we are all aware�not all publications are equally convincing or reliable even if the study was published in a well-recognized or reputable journal.
Often, data are incorrectly interpreted or misrepresented by persons or entities that have significant conflicts of interest either for their own promotion or for monetary reasons. Data dredging and data dumping also frequently occur in the literature to confuse or detract the reader from the �truth.�
Even though clinical experience plays a significant role in decision making and patient care, relying solely on this experience and theories based on pathophysiology can be misleading, inefficient, and possibly costly.
Systematically examining the literature increases confidence in our strengths and sheds light on areas of weakness.
Next slideLearning how to critically evaluate and scrutinize evidence is a good skill to develop and a necessary one to cultivate because as we are all aware�not all publications are equally convincing or reliable even if the study was published in a well-recognized or reputable journal.
Often, data are incorrectly interpreted or misrepresented by persons or entities that have significant conflicts of interest either for their own promotion or for monetary reasons. Data dredging and data dumping also frequently occur in the literature to confuse or detract the reader from the �truth.�
Even though clinical experience plays a significant role in decision making and patient care, relying solely on this experience and theories based on pathophysiology can be misleading, inefficient, and possibly costly.
Systematically examining the literature increases confidence in our strengths and sheds light on areas of weakness.
Next slide
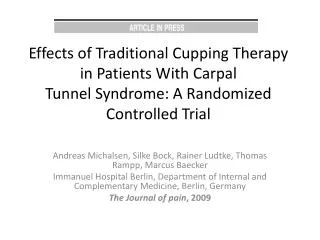
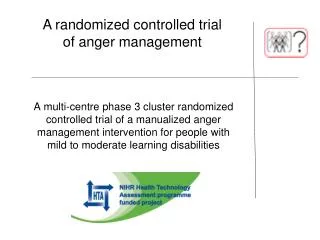
11. Turner, et al. NEJM2008;358:252-60 This is just 1 example where there is some evidence of misrepresentation of results in published trials compared with trials submitted to the FDA for new drug approval.
In the this study titled: selective publication of antidepressent trilas and its influcem on apparent efficacy, Dr. Turner and colleagues obtained reviews of trials submitted to the FDA for studies of 12 antidepressants. Dr Turner compared the results and outcomes in these review documents with the results and outcomes reported in articles published in peer review journals.
Of the 74 studies registered with the FDA, about 69% were published in journals�meaning that data in 31% of the registered studies were not published and therefore not able to be considered by clinicians. Not publishing this data contributes to what is known as publication bias�something that is difficult to control and resolve.
In addition to publication bias, Dr turner and colleagues noticed that studies that were viewed by the FDA as having �questionable or negative results� were more likely to not be published. But if they were published, the results were likely writtien in a way that conveyed a positive outcome�Of course, doing this can mislead and misrepresent the true result�this becomes a larger problem for clinicians and decision makers who do not take the time to critically assess the evidence.
Next slideThis is just 1 example where there is some evidence of misrepresentation of results in published trials compared with trials submitted to the FDA for new drug approval.
In the this study titled: selective publication of antidepressent trilas and its influcem on apparent efficacy, Dr. Turner and colleagues obtained reviews of trials submitted to the FDA for studies of 12 antidepressants. Dr Turner compared the results and outcomes in these review documents with the results and outcomes reported in articles published in peer review journals.
Of the 74 studies registered with the FDA, about 69% were published in journals�meaning that data in 31% of the registered studies were not published and therefore not able to be considered by clinicians. Not publishing this data contributes to what is known as publication bias�something that is difficult to control and resolve.
In addition to publication bias, Dr turner and colleagues noticed that studies that were viewed by the FDA as having �questionable or negative results� were more likely to not be published. But if they were published, the results were likely writtien in a way that conveyed a positive outcome�Of course, doing this can mislead and misrepresent the true result�this becomes a larger problem for clinicians and decision makers who do not take the time to critically assess the evidence.
Next slide
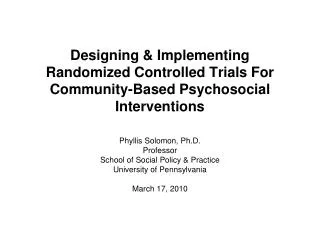
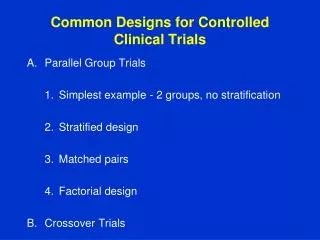
12. Benefits and challenges Benefits
Encourages objective assessment of the literature
Recognize breadth and depth of evidence base in a particular topic area Challenges
Time intensive at first
Generates more questions than answers
Potential to highlight lack of good evidence making decision making challenging
A few potential benefits of critical evaluation of literature are: that it encourages objective assessment, allows you to recognize and understand the breadth and depth of the evidence base,
A few challenges of course, is that this process requires an initial investment of time. Another challenge is that critical appraisal of the literature actually generates more questions than answers because of the limited number of well conducted and clinically relevant trials. Critcial appraisal can also highlight these gaps in the evidence base and also gaps in medical practice which not every one is comfortable with.
Next slide
�A few potential benefits of critical evaluation of literature are: that it encourages objective assessment, allows you to recognize and understand the breadth and depth of the evidence base,
A few challenges of course, is that this process requires an initial investment of time. Another challenge is that critical appraisal of the literature actually generates more questions than answers because of the limited number of well conducted and clinically relevant trials. Critcial appraisal can also highlight these gaps in the evidence base and also gaps in medical practice which not every one is comfortable with.
Next slide
�
13. Critical appraisal requires that you ask yourself: Is this relevant?
Is this valid?
Is this reliable?
Is this important and meaningful?
Is this applicable or generalizable? Critical appraisal practices requires that you ask yourself a series of 5 simple questions that are not always easy to answer:
Is this relevant
Is this valid�which is the assessment of internal validity or study quality
Is this reliable�which is the evaluation of statistical methods
Is this important and meaningful
And finally is this applicable to my patient or generalizable to the broader population
Next slideCritical appraisal practices requires that you ask yourself a series of 5 simple questions that are not always easy to answer:
Is this relevant
Is this valid�which is the assessment of internal validity or study quality
Is this reliable�which is the evaluation of statistical methods
Is this important and meaningful
And finally is this applicable to my patient or generalizable to the broader population
Next slide
14. 1. Is this article even relevant? Should I read it?
Title
Abstract
Introduction
Does this study identify a gap in the evidence?
Were the objectives clear and focused?
Should I continue?
Methods
Were inclusion and exclusion criteria clearly stated?
Are the outcomes patient-oriented or surrogate markers for long-term health outcomes?
How long was the study? (study duration) The first part of evaluating studies is to determine whether or not it is worth your time to read it. The last thing you want to do is to spend valuable time reading something that is not relevant to your work. It is the purpose of the title, and abstract to pull you in and advertise their findings�it is NOT for you to get an objective assessment of the trial. Often times, the way titles and abstracts are writtem can be slightly misleading. As for the introduction, A well-thought out trial should identify gaps in the evidence that the study is trying to fill and the objectives of the trial should be clear and focused.
Once you've deemed that the article is worth reading it is very important to take a look at the methods section. Specifically, you are looking for the inclusion and exclusion criteria to evaluate whether the population that was studied is similar to the patient you are treating or the population you are making decisions about. Additionally, you should evaluate what type of outcomes were assessed�were the outcomes intermediate or longer term health outcomes? Why were intermediate outcomes selected? Are the intermediate outcomes ones that have some validity to them�or are these intermediate outcomes created solely for this trial?. Asking these questions is very important because trials that are heavily influenced by pharmaceuitcal industry tend to look at shorter term outcomes that may exhibit benefit but don�t look at whether these benefits continue on with long term use.
And finally, evalating the length of the study is another important factor to consider. Study duration is influenced by the type of outcome that is selected. For instance, if you have longer term health outcomes�then you expect studies that are long enough to see these outcomes. Also, if you have short term outcomes like change in glycemia, you may want to consider what is a clinically relevant time period for you to see a change�is it 4 weeks or is it 12 weeks?
Next slide
�The first part of evaluating studies is to determine whether or not it is worth your time to read it. The last thing you want to do is to spend valuable time reading something that is not relevant to your work. It is the purpose of the title, and abstract to pull you in and advertise their findings�it is NOT for you to get an objective assessment of the trial. Often times, the way titles and abstracts are writtem can be slightly misleading. As for the introduction, A well-thought out trial should identify gaps in the evidence that the study is trying to fill and the objectives of the trial should be clear and focused.
Once you've deemed that the article is worth reading it is very important to take a look at the methods section. Specifically, you are looking for the inclusion and exclusion criteria to evaluate whether the population that was studied is similar to the patient you are treating or the population you are making decisions about. Additionally, you should evaluate what type of outcomes were assessed�were the outcomes intermediate or longer term health outcomes? Why were intermediate outcomes selected? Are the intermediate outcomes ones that have some validity to them�or are these intermediate outcomes created solely for this trial?. Asking these questions is very important because trials that are heavily influenced by pharmaceuitcal industry tend to look at shorter term outcomes that may exhibit benefit but don�t look at whether these benefits continue on with long term use.
And finally, evalating the length of the study is another important factor to consider. Study duration is influenced by the type of outcome that is selected. For instance, if you have longer term health outcomes�then you expect studies that are long enough to see these outcomes. Also, if you have short term outcomes like change in glycemia, you may want to consider what is a clinically relevant time period for you to see a change�is it 4 weeks or is it 12 weeks?
Next slide
�
15. 2. Is this valid? INTERNAL validity or study quality
Was the design, methods, and conduct of a study likely to have prevented or minimized bias in such a way that I can trust the findings?
With the information provided, could I reproduce this study and observe similar findings? The next step is to evaluate the validity of the trial. Which is probably the most important component to criical appraisal.
When we talk about validity�we are referring to internal validity specifically which is also referred to as study quality. First validity is the degree to which a study appropriately measures what it intends to measure by minimizing any factors that could bias the results away from what may be an estimate of a true effect. In other words, the purpose of assessing internal validity is to make sure that the design, methods, and conduct of a study have attempted to prevent or minimize biases in such a way that the findings can be trusted with confidence. You should be able to determine whether or not with the information provided, that the study could be reproduced again showing similar findings.
in the case of evaluating internal validity, it is okay to trust no one and be skeptical�.As two philosophers once stated, �trust no one unless you have eaten much salt with him.� and �skepticism is the chastity of intellect.�
Next slideThe next step is to evaluate the validity of the trial. Which is probably the most important component to criical appraisal.
When we talk about validity�we are referring to internal validity specifically which is also referred to as study quality. First validity is the degree to which a study appropriately measures what it intends to measure by minimizing any factors that could bias the results away from what may be an estimate of a true effect. In other words, the purpose of assessing internal validity is to make sure that the design, methods, and conduct of a study have attempted to prevent or minimize biases in such a way that the findings can be trusted with confidence. You should be able to determine whether or not with the information provided, that the study could be reproduced again showing similar findings.
in the case of evaluating internal validity, it is okay to trust no one and be skeptical�.As two philosophers once stated, �trust no one unless you have eaten much salt with him.� and �skepticism is the chastity of intellect.�
Next slide
16. A few words about �quality� Means different things to different people
In the context of this module, �quality� refers to methodologic quality or�
Study quality = quality assessment = internal validity
NOT the same as quality of reporting
Remember: �not reported� ? �not performed�
Sometimes difficult to differentiate between the two
Subjective process�may use dual review
Before going any further however, I would like to say a few words about �quality� which appeared on the previous slide.
Quality means different things to different people. As mentioned however, when we talk about quality�we are referring to the methodologic quality of a trial. This is different from the quality of reporting in a trial�just because something is not reported does not mean that it was not performed. However, we realize that these are difficult concepts to differentiate esp because of the high potential to manipulate and misrepresent study findings. Hence, part of quality assessment requires judgement and may be somewhat subject. To alleviate some question of subjectivity, dual review of each of the internal validity compoents can be performed.
Despite some of the gray areas that may be encountered with evaluating internal validity, the systematic process of examining each internal component helps us with our confidence in the results.
Next slideBefore going any further however, I would like to say a few words about �quality� which appeared on the previous slide.
Quality means different things to different people. As mentioned however, when we talk about quality�we are referring to the methodologic quality of a trial. This is different from the quality of reporting in a trial�just because something is not reported does not mean that it was not performed. However, we realize that these are difficult concepts to differentiate esp because of the high potential to manipulate and misrepresent study findings. Hence, part of quality assessment requires judgement and may be somewhat subject. To alleviate some question of subjectivity, dual review of each of the internal validity compoents can be performed.
Despite some of the gray areas that may be encountered with evaluating internal validity, the systematic process of examining each internal component helps us with our confidence in the results.
Next slide
17. Threats toINTERNAL validity Randomization
Allocation concealment
Blinding
Attrition
Statistical analysis
Other
Post-randomization exclusions
Crossovers
Contamination
There are 4 types of biases that threaten the validity of trials. These include selection bias�which produces systematic differences between groups that may affect or influence under-or overestimation of treatment effects; performance bias�which produces systematic differences in care provided to those in the comparison group than the intervention group; detection bias�which produces systematic differences in the way outcomes are assessed or collection; and finally attrition bias�which refers to differences between groups in the number of patients or subject who withdrew from the study
The solution to evaluting whether such biases occurred in trials is to assess whether:
Adequate Randomization, Allocation concealment, Blidning, reporting of attrition and appropriate statistical analyses were performed.
In addition to these areas that affect the 4 larger areas of biases, We will also briefly review the impact of post-randomization exclusion, cross overs, and contamination.
Next slide
18. Is this valid?: INTERNAL validity Randomization:
Adequate (unbiased): computerized random number generator, random number table
Inadequate (biased): by hospital number, date of birth, alternate assignment
Allocation concealment
Adequate (unbiased): interactive voice response system, sealed, opaque envelopes that are coded and handled by a third party (centralized or pharmacy-controlled)
Inadequate (biased): serially numbered envelopes (even sealed opaque envelopes can be subject to manipulation), open lists The solution to reducing the potential for selection bias is to test whether adequate randomization and allocation concealment of patients to their respective treatment groups occurred. By virtue of randomly assigning patients to certain groups helps evenly distribute any potential confounding factors that could affect the final outcomes. Preferred methods of randomization include: computerized random number generator or random number tables. Assigning patients to treatment groups by medical record numbers, date of birth, or alternate assignment are inadequate methods and do not protect against the potential for avoiding threats to selction bias.
Allocation concealment refers to the measures that are taken to conceal the randomization process such that investigators or study personnel are unable to predict which patients are assigned to which treatment or comparator groups. Typically, interactive voice response systems or the use of pharmacy controlled methods are preferred over uncontrolled systems such as serially numbered envelopes or open lists.
The best way to verify whether randomization and allocation concealment occurred is to look at the baseline characteristics of the patients who were enrolled, were both treatment groups fairly balanced?
Keep in mind, that there may be cases where despite measures to perform adequate randomization and allocation concealment�assessment of patient groups may still not be balanced�this may be due to chance and attributed to inadequate sample size.
Next slide
The solution to reducing the potential for selection bias is to test whether adequate randomization and allocation concealment of patients to their respective treatment groups occurred. By virtue of randomly assigning patients to certain groups helps evenly distribute any potential confounding factors that could affect the final outcomes. Preferred methods of randomization include: computerized random number generator or random number tables. Assigning patients to treatment groups by medical record numbers, date of birth, or alternate assignment are inadequate methods and do not protect against the potential for avoiding threats to selction bias.
Allocation concealment refers to the measures that are taken to conceal the randomization process such that investigators or study personnel are unable to predict which patients are assigned to which treatment or comparator groups. Typically, interactive voice response systems or the use of pharmacy controlled methods are preferred over uncontrolled systems such as serially numbered envelopes or open lists.
The best way to verify whether randomization and allocation concealment occurred is to look at the baseline characteristics of the patients who were enrolled, were both treatment groups fairly balanced?
Keep in mind, that there may be cases where despite measures to perform adequate randomization and allocation concealment�assessment of patient groups may still not be balanced�this may be due to chance and attributed to inadequate sample size.
Next slide
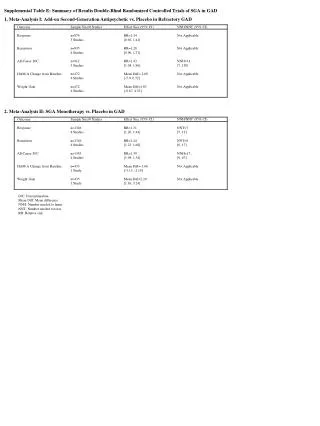
19. Example Adapted from Elwood. Critical appraisal of Epi studies and Clin trials 1998 Here is an example of a baseline demographics table. This trial compared the effects of tolbutamide with placebo on the outcome of cardiovscular events or deaths. As a reader, you must use your clinical expertise to determine whether there were any clinically significant imbalances in certain population characteristics that could confound the results that may under or overestimate tolbutamide�s effects. Keep in mind, sometimes p-values are reported in these tables but we caution you regarding p-values listed in the demographics tables. Sometimes, p-values listed are meaningless esp when the study power is small.
please take some time to look assess wehter you believe the characteristics between the groups was fairly balanced��pause�.some may say that the groups were not well balanced because of small but possiblyy clinically signiciant differences in age which may be a factor in cv events or deahts; digitalis use; and cholesterol level differences.
Next slideHere is an example of a baseline demographics table. This trial compared the effects of tolbutamide with placebo on the outcome of cardiovscular events or deaths. As a reader, you must use your clinical expertise to determine whether there were any clinically significant imbalances in certain population characteristics that could confound the results that may under or overestimate tolbutamide�s effects. Keep in mind, sometimes p-values are reported in these tables but we caution you regarding p-values listed in the demographics tables. Sometimes, p-values listed are meaningless esp when the study power is small.
please take some time to look assess wehter you believe the characteristics between the groups was fairly balanced��pause�.some may say that the groups were not well balanced because of small but possiblyy clinically signiciant differences in age which may be a factor in cv events or deahts; digitalis use; and cholesterol level differences.
Next slide
20. Is this valid?: INTERNAL validity Blinding
Single-blind, double-blind, triple-blind, open-label, double-dummy
Who was blinded?
Was blinding maintained?
Is blinding essential or possible in every situation?
Important when outcome measures involve some subjectivity
May be less important when outcome measure is death
The next solution to reducing the potential for performance and detection bias is with blinding�that is, blinding of patients, care takers, investigators, nurses, or lab technicians. A few terms that you�ve probably seen are: single-blind, double-blind, triple blind, open-label, and double dummy. It is important to try and assess who was blinded and whether you believe blinding was maintained.
For the most part, blinding is very important esp when outcome measures involve some subjectivity but it may not always be essential or possible in every situaton. Blinding may be less important when the outcome mesure is death.
All in all, for blinding, therapy administered in the comparator arm should be as �identical� to the therapy adminited in the treatment arm.
Next slide.
21. Examples Aspirin 1 gram vs. placebo post-MI
Double-blind
Risk of bleeding?
Ascorbic acid 1 gram vs. placebo for the common cold
Double-blind
Taste difference?
Esomeprazole vs. Omeprazole for erosive esophagitis
Double-dummy
Appearance? A few examples of where blinding may be important in minimizing potential performance or deteection bias are illustrated here.
The risk of bleeding associated with high ASA doses used for treatment post-MI could unblind investigators, nurses, and patients to what treatment group they are assigned to. If investigators and patients are able to determine the group they are in, they may be more alert to adverse events or treatment outcomes than someone who remains blinded. The same is true for patients who are randomized to high dose vitamin C group for the common cold�here taste difference can unblind patients.
And for the last example, A double-dummy method was used for blinding for esomeprazole and omeprazole to standardize their appearance. This double-dummy method, may not be applicable, appropratie, or feasible in all situations.
Next slide
A few examples of where blinding may be important in minimizing potential performance or deteection bias are illustrated here.
The risk of bleeding associated with high ASA doses used for treatment post-MI could unblind investigators, nurses, and patients to what treatment group they are assigned to. If investigators and patients are able to determine the group they are in, they may be more alert to adverse events or treatment outcomes than someone who remains blinded. The same is true for patients who are randomized to high dose vitamin C group for the common cold�here taste difference can unblind patients.
And for the last example, A double-dummy method was used for blinding for esomeprazole and omeprazole to standardize their appearance. This double-dummy method, may not be applicable, appropratie, or feasible in all situations.
Next slide
22. Is this valid?: INTERNAL validity D. Attrition
Was the total number of participants who withdrew reported for each group?
Were reasons for withdrawal provided?
Includes: adverse events, lost to follow-up, protocol violation, or lack of efficacy
A method of evaluating whether attrition bias had a significant impact on treatment effect is to assess the total number of patients who withdrew from each group due to any cause. You also want to asess wehther there was high differential withdrawal rate between treatment groups. If there is a significant difference in withdrwals it is important to seek out reasons for withdrawal�was it due to adverse events, lost to follow-up, protocol violation, or lack of efficacy?
Next slideA method of evaluating whether attrition bias had a significant impact on treatment effect is to assess the total number of patients who withdrew from each group due to any cause. You also want to asess wehther there was high differential withdrawal rate between treatment groups. If there is a significant difference in withdrwals it is important to seek out reasons for withdrawal�was it due to adverse events, lost to follow-up, protocol violation, or lack of efficacy?
Next slide
23. Is this valid?: INTERNAL validity Commonly reported methods of analysis
Intention-to-treat
Always verify the numbers yourself
Practical issue: depending on the reason behind the missing data, may allow for <3-5% difference in baseline ITT numbers.
Other popular approaches: last observation carried forward (LOCF), as-treated or Per-protocol analyses, data not imputed, mixed modeling, etc.
The most common method of trying to preserve the validity of comparisons between treatment groups and reduce the potential for attrition bias in randomized trials is by using intention-to-treat analysis. This type of analysis includes data from all randomized patients regardless of the treatment received and regardless of the withdrawal from the trial. However, when there are high rates of withdrawal or missing data, even intention-to-treat cannot help protect against biasing results. For intention-to-treat analysis to be reasonably useful requires a fair to good retention of patients during the trial. And as a reader you can check whether there was fair to good retention of patients by verifying the intention-to-treat numbers yourself by looking at the total number of patients who were included in the analysis relative to the total number of patients randomized to treatment. Depending on the reasons behind missing data, it may be reasonable to allow for a 3-5% difference in the intention-to-treat numbers compared with baseline numbers.
Other popular approaches to minimize the potential for attrition bias and missing data include: last observation carried forward, as-treated or per-protocol analyses, data not imputed, or mixed modeling.
Details for each of these methods and their caveats are reviewed in an article by Dr. Doug Altman and the reference is provided for you under online resources which is located in the attachments tab.
Next slideThe most common method of trying to preserve the validity of comparisons between treatment groups and reduce the potential for attrition bias in randomized trials is by using intention-to-treat analysis. This type of analysis includes data from all randomized patients regardless of the treatment received and regardless of the withdrawal from the trial. However, when there are high rates of withdrawal or missing data, even intention-to-treat cannot help protect against biasing results. For intention-to-treat analysis to be reasonably useful requires a fair to good retention of patients during the trial. And as a reader you can check whether there was fair to good retention of patients by verifying the intention-to-treat numbers yourself by looking at the total number of patients who were included in the analysis relative to the total number of patients randomized to treatment. Depending on the reasons behind missing data, it may be reasonable to allow for a 3-5% difference in the intention-to-treat numbers compared with baseline numbers.
Other popular approaches to minimize the potential for attrition bias and missing data include: last observation carried forward, as-treated or per-protocol analyses, data not imputed, or mixed modeling.
Details for each of these methods and their caveats are reviewed in an article by Dr. Doug Altman and the reference is provided for you under online resources which is located in the attachments tab.
Next slide
24. E. Statistical analysis
Was the method appropriate?
What is the potential for type I or type II error?
Adequate power?
False positive
False negative
Selective analysis of data ? selective reporting
Example: calculating statistical significant p-value for A1c at week 26 instead of week 52 Is this valid?: INTERNAL validity Once you�ve assessed for selection, performance, detection, and attrition bias, the next step is to assess how statistics were used in a study and whether they were used appropriately.
as you know, statistical incorrectness in trials can take on many guises and therefore, it is important to evaluate for the potential for type 1 or type 2 errors that may be brought upon by inadequate sample size or high lost to follow-up. Type 1 error is also referred to as finding a false positive result whereas type 2 error is referred to as finding a false negative result.
Another area that should be critically evaluated is the potential for selective analysis of data. An example of this would be selectively calculating statistically significant p-value for a change in A1c at week 26 instead of at week 52�which showed no difference.
Next slideOnce you�ve assessed for selection, performance, detection, and attrition bias, the next step is to assess how statistics were used in a study and whether they were used appropriately.
as you know, statistical incorrectness in trials can take on many guises and therefore, it is important to evaluate for the potential for type 1 or type 2 errors that may be brought upon by inadequate sample size or high lost to follow-up. Type 1 error is also referred to as finding a false positive result whereas type 2 error is referred to as finding a false negative result.
Another area that should be critically evaluated is the potential for selective analysis of data. An example of this would be selectively calculating statistically significant p-value for a change in A1c at week 26 instead of at week 52�which showed no difference.
Next slide
25. Is this valid?: INTERNAL validity F. Other
- Post-randomization exclusions, crossovers, contamination?
Were any groups of participants excluded during the course of study?
Why? Was this significant? There are a few additional factors that may further reduce threats to validity. These include whether there were any significant post randomization exclusions of patients which could affect the balance of patient groups and whether treatment crossover or contamination occurred again affecting the balance of patient groups and the additional confounding factors.
Next slide
There are a few additional factors that may further reduce threats to validity. These include whether there were any significant post randomization exclusions of patients which could affect the balance of patient groups and whether treatment crossover or contamination occurred again affecting the balance of patient groups and the additional confounding factors.
Next slide
26. Is this valid? For Harms Apply similar concepts and also ask:
How was harms monitored?
Active or passive methods?
Who assessed the harms?
Study investigator or third party?
When and how often were the assessments conducted?
Face-to-face or over the phone?
Various terms used
Safety = fading out (except with FDA)
Adverse effect= undesirable outcome with reasonable causal association
Adverse event= undesirable outcome with unknown causal association
Tolerability= ability or willingness to tolerate unpleasant drug-related events without serious or permanent sequelae
Chou, et al. J Clin Epi 2008. Sept 25 (Epub ahead of print, in press) Remember that critical appraisal of the literature not only entails that you asses whether a treatment is beneficial but whether harms associated with that treatment exist as well. Unfortunately, short-term randomized trial design isn�t always the best level of evidence to assess harms. Longer and larger effectiveness trials or observational studies may provide more meaningful results on harms.
Nonetheless, similar concepts of critically reading for information on harms should be undertaken. The following are a few questions to ask yourself when reading trials or observational studies: How were the adverse events or harms monitored? Were harms gathered actively or passively? Who assessed the harms? Was it the study investigators or an external third party? When and how often were the harms assessed? Were they face to face or over the phone?
The terminology used in trials and by methodologists is slowly changing. Instead of using the term safety which sounds more reassuring, the term harms is being used. The term safety however continues to be used by the FDA. Also, there are some slight differences to how adverse effect, adverse event, and tolerability are defined. An adverse effect is defined as an undesirable outcome with reasonable causal association to a drug treatment; adverse event is slightly different in that there is an unknown causal association; and tolerability is a term with many definitions but here we will define it as the ability of willing to tolerate unpleasant drug-related events without serious or permanent problems.
Next slideRemember that critical appraisal of the literature not only entails that you asses whether a treatment is beneficial but whether harms associated with that treatment exist as well. Unfortunately, short-term randomized trial design isn�t always the best level of evidence to assess harms. Longer and larger effectiveness trials or observational studies may provide more meaningful results on harms.
Nonetheless, similar concepts of critically reading for information on harms should be undertaken. The following are a few questions to ask yourself when reading trials or observational studies: How were the adverse events or harms monitored? Were harms gathered actively or passively? Who assessed the harms? Was it the study investigators or an external third party? When and how often were the harms assessed? Were they face to face or over the phone?
The terminology used in trials and by methodologists is slowly changing. Instead of using the term safety which sounds more reassuring, the term harms is being used. The term safety however continues to be used by the FDA. Also, there are some slight differences to how adverse effect, adverse event, and tolerability are defined. An adverse effect is defined as an undesirable outcome with reasonable causal association to a drug treatment; adverse event is slightly different in that there is an unknown causal association; and tolerability is a term with many definitions but here we will define it as the ability of willing to tolerate unpleasant drug-related events without serious or permanent problems.
Next slide
27. Tools for assessing internal validity There are > 25 different scales and tools for assessing the internal quality of a trial
Jadad scale
Chalmers scale
Cochrane Risk of Bias tool
DERP method
Adapted from US Preventative Task Force (USPTF) and National Health Service Centre for Reviews and Dissemination (UK) We�ve just finished reviewing the common key threats to internal validity and methods to evaluate whether bias was reduced such that results can be trusted. To help remember all the components of internal validity, tools and scales were developed by clinicians and methodologists. Currently, there are more than 25 different scales and tools available.
Commonly referenced tools are the: Jadad scale, Chalmers scale, the new Cochrane risk of bias tool, and the DERP method of quality assessment which is based on criteria from the US preventative task force and the national health services center for reviews and dissemination.
it is important to mention that there is no 1 gold standard tool, scale, or scoring system for determining internal validy or study quality. All the different methods have their strengths and limitations but in general most tools evaluate the key concepts involved in minimizing bias.
Next slide
We�ve just finished reviewing the common key threats to internal validity and methods to evaluate whether bias was reduced such that results can be trusted. To help remember all the components of internal validity, tools and scales were developed by clinicians and methodologists. Currently, there are more than 25 different scales and tools available.
Commonly referenced tools are the: Jadad scale, Chalmers scale, the new Cochrane risk of bias tool, and the DERP method of quality assessment which is based on criteria from the US preventative task force and the national health services center for reviews and dissemination.
it is important to mention that there is no 1 gold standard tool, scale, or scoring system for determining internal validy or study quality. All the different methods have their strengths and limitations but in general most tools evaluate the key concepts involved in minimizing bias.
Next slide
28. Example: Jadad scale This is the Jadad scale�and is one of the more commonly used assessment tools. It was originally developed by Alejandro Jadad who used the tool to evaluate the internal validity components of pain trials.
This scale looks at randomization, method of randomization, methods of blinding�particulary double-blinding, and withdrawal or drop out rates. And for each critieria a score is given. The scoring ranging between 0 and 5. Poor qulaity is designated with scores less than 3 while scores 4 and 5 indicate good internal validity.
This scale is not with out it�s critics however, many have stated that categorizing study quality based on a numeric designation is over simplistic and is prone to high rates of inter-rater variability.
Next slideThis is the Jadad scale�and is one of the more commonly used assessment tools. It was originally developed by Alejandro Jadad who used the tool to evaluate the internal validity components of pain trials.
This scale looks at randomization, method of randomization, methods of blinding�particulary double-blinding, and withdrawal or drop out rates. And for each critieria a score is given. The scoring ranging between 0 and 5. Poor qulaity is designated with scores less than 3 while scores 4 and 5 indicate good internal validity.
This scale is not with out it�s critics however, many have stated that categorizing study quality based on a numeric designation is over simplistic and is prone to high rates of inter-rater variability.
Next slide
29. Example: Cochrane �Risk of bias� tool Fairly recently, Cochrane modified their methods for evaluating �internal validity��they refer to their tool as the risk of bias tool. This tool also evaluates whether adequate randomization, allocation concealment, and blinding occurred. In addition, this tool looks at completeness of outcome data reporting, selective reporting of results, and other potential biases like postrandomization exclusions.
A more in-depth look at the criteria for the risk of bias tool can be found at the cochrane website.
Next slideFairly recently, Cochrane modified their methods for evaluating �internal validity��they refer to their tool as the risk of bias tool. This tool also evaluates whether adequate randomization, allocation concealment, and blinding occurred. In addition, this tool looks at completeness of outcome data reporting, selective reporting of results, and other potential biases like postrandomization exclusions.
A more in-depth look at the criteria for the risk of bias tool can be found at the cochrane website.
Next slide
30. Example: DERP method This is another example of a quality assessment tool used by the drug Effectiveness revie project group�this tool is adapted from criteria from the US PTF and Center for reviews and Dissemination in the UK. Unlike the Jadad scale which uses a score, this is based on a more qualitative approach�that is rating trials as good, fair, or poor. Keep in mind that this specific example is for randomized trials�there are other critieria for observational studies. Tehse critieria can be found on the DERP website under methods.
The rating of good requires an almost perfect fulfillment of each criteria. A poor rating is either based on a serious fatal flaw or a combination of flaws such as inadequate randomization, high withdrawal rate esp in 1 group more than other, lack of ITT analysis and so on�while everything else falls into the fair quality Each quality rating lies on a spectrum of good, fair, and poor and again, dual review should be performed esp when systematic reviews are undertaken
Feel free to take a closer look at each component.
Next slide
This is another example of a quality assessment tool used by the drug Effectiveness revie project group�this tool is adapted from criteria from the US PTF and Center for reviews and Dissemination in the UK. Unlike the Jadad scale which uses a score, this is based on a more qualitative approach�that is rating trials as good, fair, or poor. Keep in mind that this specific example is for randomized trials�there are other critieria for observational studies. Tehse critieria can be found on the DERP website under methods.
The rating of good requires an almost perfect fulfillment of each criteria. A poor rating is either based on a serious fatal flaw or a combination of flaws such as inadequate randomization, high withdrawal rate esp in 1 group more than other, lack of ITT analysis and so on�while everything else falls into the fair quality Each quality rating lies on a spectrum of good, fair, and poor and again, dual review should be performed esp when systematic reviews are undertaken
Feel free to take a closer look at each component.
Next slide
31. Example The Center for Evidence-based Medicine. Oxford. http://www.cebm.net If you want to practice evaluating internal validity, you can visit the website for the Center for Evidence based Medicine in Oxford and find this document or click under attachments in the upper tab of this module. This document goes over each of the components that we discussed and provides explanations along the way.
Next slideIf you want to practice evaluating internal validity, you can visit the website for the Center for Evidence based Medicine in Oxford and find this document or click under attachments in the upper tab of this module. This document goes over each of the components that we discussed and provides explanations along the way.
Next slide
32. Is this relevant?
Is this valid?
Is this reliable?
Is this important and meaningful?
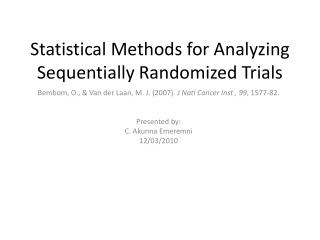
Is this applicable or generalizable? The next step in critical appraisal of randomized trials is assessing whether the actual results are reliable by taking a closer look at the methods used to describe the results.
Next slideThe next step in critical appraisal of randomized trials is assessing whether the actual results are reliable by taking a closer look at the methods used to describe the results.
Next slide
33. 3. Are the results reliable? Were all the results reported?
Was there evidence of selective outcome reporting?
How were the results reported? And are they easy to read or determine?
How large is the treatment effect?
Relative risk, relative risk reduction, odds ratio, absolute risk reduction, number needed to treat
How precise is the estimate of the effect?
How narrow or wide is the confidence interval?
Where does the point estimate fall? The first question you want to ask is: were all the results reported for all the outcomes that were to be assessed? Or was there evidence of selective outcome reporting? How were the results reported? Was it in such a way that I am having difficulty finding the true answer?
Another aspect of determining whether results are reliable is to look at how the results are presented�that is looking at the treatment effect in terms of RR, OR, ARR, NNT. Depending on which measures of effect is chosen the impact may be large or small using the same data set. And therefore it is also wise to assess the precision of the estimate by looking at confidence intervals and how large or small it is as well as where the estimate falls.
in the next few slides�we will touch on addressing these questions.
Next slide.The first question you want to ask is: were all the results reported for all the outcomes that were to be assessed? Or was there evidence of selective outcome reporting? How were the results reported? Was it in such a way that I am having difficulty finding the true answer?
Another aspect of determining whether results are reliable is to look at how the results are presented�that is looking at the treatment effect in terms of RR, OR, ARR, NNT. Depending on which measures of effect is chosen the impact may be large or small using the same data set. And therefore it is also wise to assess the precision of the estimate by looking at confidence intervals and how large or small it is as well as where the estimate falls.
in the next few slides�we will touch on addressing these questions.
Next slide.
34. Brief overview of:
Relative risk
Odds ratio
Absolute risk
Number needed to treat
P-value
Confidence intervals In randomized trials the effects of new treatments on dichotomous outcomes can be expressed in several ways. And again, depending on which measures of effect is chosen the impact may be large or small using the same data set. In the next few slides we will briefly re-review a few of these methods like RR, OR, which are relative measures AR, and NNT which are more absolute measures and point out some ways to verify their findings looking at both P-values and confidence intervals (with an emphasis on confidence intervals). As william watt put it, �do not put your faith in what statistics say until you have carefully considered what they do not say.�
Next slideIn randomized trials the effects of new treatments on dichotomous outcomes can be expressed in several ways. And again, depending on which measures of effect is chosen the impact may be large or small using the same data set. In the next few slides we will briefly re-review a few of these methods like RR, OR, which are relative measures AR, and NNT which are more absolute measures and point out some ways to verify their findings looking at both P-values and confidence intervals (with an emphasis on confidence intervals). As william watt put it, �do not put your faith in what statistics say until you have carefully considered what they do not say.�
Next slide
35. Is this reliable?: Interpreting data Relative risk (RR)= event rate or risk ratio
RR = 1 (no difference)
RR < 1 (intervention lowers the risk of the outcome)
RR > 1 (treatment increases the risk of the outcome)
Relative risk reduction (RRR) Relative risk or odds ratio are reported for dichotomous data. Relative risk is also referred to as risk ratio�measures the event rate of an outcome in 1 group compared to another. Because RR is a ratio, an event rate equaling 1 indicates no difference bw the groups while a rate of less than 1 implies lower risk of an outcome and while a rate of greater than 1 indicates increase in risk of an outcome. Sometimes the term �risk� can be a little misleading�suggesting something harmful�but there are many instances where RR is calculated for positive outcomes.
Relative risk reduction is just another way of interpreting relative risk�it converts the relative risk into a proportion�and often this value is quite impressive and if you are unaware may mislead the reader into believing the effect is quite larger than the absolute difference in treatment group rates!!
Next slide
Relative risk or odds ratio are reported for dichotomous data. Relative risk is also referred to as risk ratio�measures the event rate of an outcome in 1 group compared to another. Because RR is a ratio, an event rate equaling 1 indicates no difference bw the groups while a rate of less than 1 implies lower risk of an outcome and while a rate of greater than 1 indicates increase in risk of an outcome. Sometimes the term �risk� can be a little misleading�suggesting something harmful�but there are many instances where RR is calculated for positive outcomes.
Relative risk reduction is just another way of interpreting relative risk�it converts the relative risk into a proportion�and often this value is quite impressive and if you are unaware may mislead the reader into believing the effect is quite larger than the absolute difference in treatment group rates!!
Next slide
36. Limitations of risk ratios Study 1 (outcome): death from any cause
Treatment: 1%
Placebo: 2%
RR= 0.50 and RRR= 50%
Study 2 (outcome): death from any cause
Treatment: 25%
Placebo: 50%
RR= 0.50 and RRR= 50% This slide may look familiar if you�ve viewed the modules by Dr. Dean Haxby. This just illustrates the limitations with risk ratios in their inability to reveal the actual differences in rates between treatment and comparator groups and their inability to convey the clinical implications if you don�t calculate the risk difference or number needed to treat.
Next slide
This slide may look familiar if you�ve viewed the modules by Dr. Dean Haxby. This just illustrates the limitations with risk ratios in their inability to reveal the actual differences in rates between treatment and comparator groups and their inability to convey the clinical implications if you don�t calculate the risk difference or number needed to treat.
Next slide
37. Odds for an event within a single group
Odds ratio compares the odds across groups
OR = 1 (no difference)
OR < 1 (lowers the odds of experiencing the outcome)
OR > 1 (increases the odds of experiencing the outcome)
When it comes to Odds and Odds ratio, many reader cringe. Briefly, when calculating the odds of an event within a single group�you are looking at the odds of a certain outcome occuring to the odds of that event NOT occurring which is represnted by p over 1 minus p. The odds ratio on the other hand, estimates the odds of an event occurring in 1 group relative to the to the odds of that same event occuring in a different group. The odds ratio compares the odds across groups! When interpreting the odds ratio, it is more or less similar to how you would interpret relative risk especially in situations where the underlying rate or incidence of an outcome or event is low. As the event rate becomes larger, however, the estimates from relative risk and odds ratio diverge from one another and should not be considered being similar any longer.�this is the key�again, I�ll stress this again�when the underlying event rate or incidence of an event is low than you can interpret OR and RR similarly�the interpretation of OR and RR begin to diverge however, when the underlying event rate becomes larger�and so interpreting or using these ratios interchangeably is not always correct�.and these ratios can be potentially misused and may appear to under-or overestimate the final result.
Also, note, that the odds ratio is useful for regression analyses and for estimating event rates in case control studies unlike relative risk ratios.
Next slideWhen it comes to Odds and Odds ratio, many reader cringe. Briefly, when calculating the odds of an event within a single group�you are looking at the odds of a certain outcome occuring to the odds of that event NOT occurring which is represnted by p over 1 minus p. The odds ratio on the other hand, estimates the odds of an event occurring in 1 group relative to the to the odds of that same event occuring in a different group. The odds ratio compares the odds across groups! When interpreting the odds ratio, it is more or less similar to how you would interpret relative risk especially in situations where the underlying rate or incidence of an outcome or event is low. As the event rate becomes larger, however, the estimates from relative risk and odds ratio diverge from one another and should not be considered being similar any longer.�this is the key�again, I�ll stress this again�when the underlying event rate or incidence of an event is low than you can interpret OR and RR similarly�the interpretation of OR and RR begin to diverge however, when the underlying event rate becomes larger�and so interpreting or using these ratios interchangeably is not always correct�.and these ratios can be potentially misused and may appear to under-or overestimate the final result.
Also, note, that the odds ratio is useful for regression analyses and for estimating event rates in case control studies unlike relative risk ratios.
Next slide
38. Zhang J, et al. JAMA 1998; 280 (19):1690-1. Figure shown in this slide is from this article. Here is a graphical representation that Dr. Zhang and colleagues from the Division of Epidemiology at the NIH put together to help illustrate the point that was just made regarding differences and similarities between OR and RR.
As you can see�when the underlying event rate or incidence of an outcome is low (let�s say <10%), then the OR and RR are more similar. However, when as the incidence of the outcome becomes quite large, the OR can either underestimate the RR when it is less than 1 or overestimate the RR when it is more than 1�hence, please beware of this caveat when interpreting OR and RR and beware of misuse of these ratios in the literature�
Next slideHere is a graphical representation that Dr. Zhang and colleagues from the Division of Epidemiology at the NIH put together to help illustrate the point that was just made regarding differences and similarities between OR and RR.
As you can see�when the underlying event rate or incidence of an outcome is low (let�s say <10%), then the OR and RR are more similar. However, when as the incidence of the outcome becomes quite large, the OR can either underestimate the RR when it is less than 1 or overestimate the RR when it is more than 1�hence, please beware of this caveat when interpreting OR and RR and beware of misuse of these ratios in the literature�
Next slide
39. Is this reliable?: Interpreting data Absolute risk reduction or Risk difference
Number needed to treat to benefit or harm
Should include: duration of follow-up and the control group event rate Although RR and OR have their limitations and may be useful in certain situations or study designs, as mentioned�understanding and translating these effect measures can be difficult without knowing the absolute risk differences between the treatment and comparator groups.
ARR is the difference in the rate of risk in the treatment group from the rate of risk in the control group. * One key point about ARR or RD is that the value varies with the underlying risk of an event in an individual patient. The ARR becomes small when the underlying event rates are low. You should assess the underlying risk of the patients included in the trial you are reading and evaluate whether the rate is similar to the patient you are caring for. If the study included patients with higher underlying event rate the ARR will likely be larger. And so, you should keep this in mind!
similarly, the same concept applies to NNT since this is the inverse of ARR. Clinicians tend to like having NNT numbers because it is translated in a way that may be easier to apply and understand. remember, when using NNT you should always put this in the context of the duration of follow-up and keep in mind the underlying event rate.
Next slideAlthough RR and OR have their limitations and may be useful in certain situations or study designs, as mentioned�understanding and translating these effect measures can be difficult without knowing the absolute risk differences between the treatment and comparator groups.
ARR is the difference in the rate of risk in the treatment group from the rate of risk in the control group. * One key point about ARR or RD is that the value varies with the underlying risk of an event in an individual patient. The ARR becomes small when the underlying event rates are low. You should assess the underlying risk of the patients included in the trial you are reading and evaluate whether the rate is similar to the patient you are caring for. If the study included patients with higher underlying event rate the ARR will likely be larger. And so, you should keep this in mind!
similarly, the same concept applies to NNT since this is the inverse of ARR. Clinicians tend to like having NNT numbers because it is translated in a way that may be easier to apply and understand. remember, when using NNT you should always put this in the context of the duration of follow-up and keep in mind the underlying event rate.
Next slide
40. Example This example is based on a fictional medication (MiHaart). To illustrate RR, RRR, ARR, and NNT, here is a fictional example of a new antiplt medication for patients with acute MI. the conclusion states that the new drug MiHaart is more effective than placebo with a 25% reduction in mortality after 2 months of treatment. Based on this conclusion statement, it sounds like MiHarrt should be prescribed to all patients post acute MI.
Next slide
To illustrate RR, RRR, ARR, and NNT, here is a fictional example of a new antiplt medication for patients with acute MI. the conclusion states that the new drug MiHaart is more effective than placebo with a 25% reduction in mortality after 2 months of treatment. Based on this conclusion statement, it sounds like MiHarrt should be prescribed to all patients post acute MI.
Next slide
41. Crunching the numbers Here we calculate the RR, RRR, and ARR for the composite group of patients. The composite treatment group includes a mixture of patients with low and high CV riskf factors.
Next slideHere we calculate the RR, RRR, and ARR for the composite group of patients. The composite treatment group includes a mixture of patients with low and high CV riskf factors.
Next slide
42. Crunching the numbers As you can see RR and RRR are quite impressive compared with the ARR�keep in mind that this ARR may be considered high as well esp if the underlying event rate for an MI is high for this group.
Although it is tempting to stop here, we still need to determine if the value reported in this trials is even a good and reliable point estimate.�to do this we must evaluate the confidence interval in which it lies.As you can see RR and RRR are quite impressive compared with the ARR�keep in mind that this ARR may be considered high as well esp if the underlying event rate for an MI is high for this group.
Although it is tempting to stop here, we still need to determine if the value reported in this trials is even a good and reliable point estimate.�to do this we must evaluate the confidence interval in which it lies.
43. Is this reliable?: Interpreting data How can we determine if the �point estimate� is a good reflection of the �true� value?
The utility of the P-value
Role of the confidence interval (CI)
Since RR, OR, ARR, and NNT are only an estimate of the true risk in a larger population, it is prudent to evalute whether the estimate is a good reflection of this �true� value?
To do this, we will discuss the utility of the P-value and the role of the confidence interval.Since RR, OR, ARR, and NNT are only an estimate of the true risk in a larger population, it is prudent to evalute whether the estimate is a good reflection of this �true� value?
To do this, we will discuss the utility of the P-value and the role of the confidence interval.
44. The P-value Used to measure statistical significance in epidemiology.
By convention, p-value typically set at 0.05 (?) assumes that an event at a rate = 1 in 20 is unlikely to be due to random chance alone.
The smaller the p-value, the more unlikely the �point estimate� was due to random chance.
Does not provide the possible range of the true differences of the �point estimate� We�ve all seen these p-values in trials but most of us aren�t really sure about it�s utility. The p-value was originally used to measure the statis signif in epidemiology. By convention, the value is typically set at 0.05 which is determined by alpha and assumes that an event at a rate of more than 1 in 20 is unlikely to be due to random chance.
We all know that small p-values indicate the unlikeliness that the point estimate was due to random chance compared with larger p-values. Unfortunately, these p-values do not provide us with the possible ranges of the true differences of the point estimate from the �actual true value� in the larger population.
Next slide
We�ve all seen these p-values in trials but most of us aren�t really sure about it�s utility. The p-value was originally used to measure the statis signif in epidemiology. By convention, the value is typically set at 0.05 which is determined by alpha and assumes that an event at a rate of more than 1 in 20 is unlikely to be due to random chance.
We all know that small p-values indicate the unlikeliness that the point estimate was due to random chance compared with larger p-values. Unfortunately, these p-values do not provide us with the possible ranges of the true differences of the point estimate from the �actual true value� in the larger population.
Next slide
45. The problem with P-values P-values do not give indication of:
Treatment effect size
Precision of estimate
Direction of effect
Degrades data measures into dichotomous judgments
Significant (P<0.05)
Not Significant (P>0.05; P=NS)
Does not protect against Type I or Type II errors
Non-significant P-value = �Negative Trial� The problem with depending on p-values alone is that these do not give us an indication of treatment effect size, precision of the estimate, or the direction of the effect.
Because of its simplistic nature, misuse of the p-vlaue sometimes degrades data measures into dichotomous judgements of being significant or not significant. Having said this, p-values also do not protect against or tell us anything about the potential for type 1 (or finding a false positive results) or type 2 errors (finding a false negative results).
Remember, just because you have a non-significant p-value does not automatically indicate or mean that the trial was �negative� . The absence of evidence is not evidence of absence!!
Next slide
Does not protect against type 1 or type 2 errors, that is, concluding that there is a difference in outcomes when in fact, no such difference exists (type 1) and the probab of making such an error is designated alpha.
Type 2�when we fail to reject the null hypothesis (that there is no difference bw txmts)�and we dismiss a useful treatment�could be due to sample size�inadequate powerThe problem with depending on p-values alone is that these do not give us an indication of treatment effect size, precision of the estimate, or the direction of the effect.
Because of its simplistic nature, misuse of the p-vlaue sometimes degrades data measures into dichotomous judgements of being significant or not significant. Having said this, p-values also do not protect against or tell us anything about the potential for type 1 (or finding a false positive results) or type 2 errors (finding a false negative results).
Remember, just because you have a non-significant p-value does not automatically indicate or mean that the trial was �negative� . The absence of evidence is not evidence of absence!!
Next slide
Does not protect against type 1 or type 2 errors, that is, concluding that there is a difference in outcomes when in fact, no such difference exists (type 1) and the probab of making such an error is designated alpha.
Type 2�when we fail to reject the null hypothesis (that there is no difference bw txmts)�and we dismiss a useful treatment�could be due to sample size�inadequate power
46. The confidence interval More useful than P-value in evaluating results
Provides a range of possible values for the �true� treatment value
Width of a CI is a function of sample size
Can be calculated for means, medians, proportions, odds ratios, relative risks, NNT.
95% = most commonly calculated
Can go to http://www.openepi.com to help you calculate confidence intervals for treatment measures
The confidence interval is definitely more useful than the p-vlue in assessing how close the point estimate presents the �true� value. Unlike the p-value, the confidence interval provides a range of possible values around the �true� effect. The width of the interval can guide us in determining how reliable the results are and whether or not to recommend treatment. The size of the confidence interval is also a function of the sample size�the large the sample, the tighter the interval should become.
Confidence intervals can be calculated for means, medians, proportions, ratios, and NNT. 95% CI is typically calculated. You can also visit openepi.com which is a free online resource which can help you calc confidence intervals for your desired treatment measures. But remember this resource is not meant to substitute consultation with a biostatistician when it is needed.
Next slide
47. Same example Here we calculated the CI for ARR and NNT for the example that we just reviewed. We can now see that this new drug�s benefit is more prominent in patients with high cv risk than patients with low risk�and that it is likely that the patients with high risk drove a significant effect observed in the composite group.
Next slide
Altamn BMJ 1998; 317:1309. For CI and NNTs (NNTB and NNTH)Here we calculated the CI for ARR and NNT for the example that we just reviewed. We can now see that this new drug�s benefit is more prominent in patients with high cv risk than patients with low risk�and that it is likely that the patients with high risk drove a significant effect observed in the composite group.
Next slide
Altamn BMJ 1998; 317:1309. For CI and NNTs (NNTB and NNTH)
48. Confidence intervals andtrials that appear �negative� Swedish Cooperative Stroke Study (N=505)
Aspirin= 9% nonfatal stroke
Placebo= 7% nonfatal stroke
Risk difference= -2%
95% CI (-7% to 3%)
Guyatt G, et al. CMAJ 1995; 152 (2):169-73. Using confidence intervals WITH clinical insight and experience is also very important in helping to interpret trial results. Here we will discuss how confidence intervals can help us interpret trials that appear negative.
Dr. Sackett and colleagues evaluated results form the Swed Coop Stroke study which was designed to assess whether aspirin would prevent fewer strokes compared with placebo. In this trial, the rate of nonfatal stroke for those in the aspirin arm was 9% relative to 7% in the placebo group. The risk difference was a 2% increase in strokes with aspirin therapy. 95% CI surrounding this 2% risk difference was between -7% to 3%. This confidence interval crossed 0 (which is the area of no difference or no effect)�it is tempting to conclude that this was a negative study just based on this alone.Using confidence intervals WITH clinical insight and experience is also very important in helping to interpret trial results. Here we will discuss how confidence intervals can help us interpret trials that appear negative.
Dr. Sackett and colleagues evaluated results form the Swed Coop Stroke study which was designed to assess whether aspirin would prevent fewer strokes compared with placebo. In this trial, the rate of nonfatal stroke for those in the aspirin arm was 9% relative to 7% in the placebo group. The risk difference was a 2% increase in strokes with aspirin therapy. 95% CI surrounding this 2% risk difference was between -7% to 3%. This confidence interval crossed 0 (which is the area of no difference or no effect)�it is tempting to conclude that this was a negative study just based on this alone.
49. Trials that appear �negative� Here is a visual depiction of the results. The box is the -2% point estimate. The 95% CI around the point estimate of -2% in favor of placebo ranges from -7% to 3% which is in favor of ASA. If, in fact you deem 3% to be clinically relevant in avoiding a stroke, than this means that 3% of patient who had strokes would have been spared if they had taken ASA, and you would certainly want to administer ASA. The 3% roughly translates into an estimate of 33 patients being treated so that 1 stroke could be avoided. If this is the case, then this trial did not exclude a clinically important benefit and therefore did not have a large enough sample size to exclude the benefit from ASA. Therefore, you cannot conclude that this trial was definitely negative since there benefit could not be ruled out.
�
Let�s say, however, that you do not consider 3% to be an indication of adequate benefit and instead say that (for arguments sake) 5% is the smallest clinically relevant benefit that you would want to see. In this case, the confidence interval did not include the benefit and so, you could conclude that this trial was definitely negative.
�
Next slideHere is a visual depiction of the results. The box is the -2% point estimate. The 95% CI around the point estimate of -2% in favor of placebo ranges from -7% to 3% which is in favor of ASA. If, in fact you deem 3% to be clinically relevant in avoiding a stroke, than this means that 3% of patient who had strokes would have been spared if they had taken ASA, and you would certainly want to administer ASA. The 3% roughly translates into an estimate of 33 patients being treated so that 1 stroke could be avoided. If this is the case, then this trial did not exclude a clinically important benefit and therefore did not have a large enough sample size to exclude the benefit from ASA. Therefore, you cannot conclude that this trial was definitely negative since there benefit could not be ruled out.
�
Let�s say, however, that you do not consider 3% to be an indication of adequate benefit and instead say that (for arguments sake) 5% is the smallest clinically relevant benefit that you would want to see. In this case, the confidence interval did not include the benefit and so, you could conclude that this trial was definitely negative.
�
Next slide
50. Confidence intervals andtrials that appear �positive� Enalapril in LV Dysfunction, SOLVD (N=1285)
Enalapril= 47.7% died or worsening HF
Placebo= 57.3% died or worsening HF
Risk difference= 9.6% (~10%)
95% CI (6% to 14%)
Guyatt G. CMAJ 1995; 152(2): 169-73. Here is another example of using confidence intevals in trials that appear positive esp if you have a confidence interval that didn�t cross 0 and you had a p-value of <0.05.
The SOLVD trial evalauted the rate of death or worsening HF in patients with LV dysfunction who were randomized to receive enalpril or placebo. By the end of the trial, about 48% of patients in the enapril group died or had worse HF compared with about 57% of patients on placebo. Just looking at the risk difference�there was a 10% difference in death or worsening HF favoring treamtent with enalapril and the CI ranged bw 6 to 14%.Here is another example of using confidence intevals in trials that appear positive esp if you have a confidence interval that didn�t cross 0 and you had a p-value of <0.05.
The SOLVD trial evalauted the rate of death or worsening HF in patients with LV dysfunction who were randomized to receive enalpril or placebo. By the end of the trial, about 48% of patients in the enapril group died or had worse HF compared with about 57% of patients on placebo. Just looking at the risk difference�there was a 10% difference in death or worsening HF favoring treamtent with enalapril and the CI ranged bw 6 to 14%.
51. Trials that appear �positive� Again, here is visual depiction. The point estimate of death or hospital admission for heart failure was 10% and the confidence interval was 6 to 14%. The smallest true effect of Enalapril in this trial is a 6% reduction in the number of patients who experience death or worsening of HF. If, 6% is considered the minimum reduction necessary to avoid an adverse outcome, then this trial definitely showed a psotive benefit.
But if 6% is not considered the minimum�but let�s say,it is 7%--then you could infer from the confidence interval that a larger sample would be required (in this case). This is because 6% which is not considered relevant was included in the CI.
For both scenarios, clinical insight and experience can help you with interreting CI and interpreting the results in a trial.
Next slideAgain, here is visual depiction. The point estimate of death or hospital admission for heart failure was 10% and the confidence interval was 6 to 14%. The smallest true effect of Enalapril in this trial is a 6% reduction in the number of patients who experience death or worsening of HF. If, 6% is considered the minimum reduction necessary to avoid an adverse outcome, then this trial definitely showed a psotive benefit.
But if 6% is not considered the minimum�but let�s say,it is 7%--then you could infer from the confidence interval that a larger sample would be required (in this case). This is because 6% which is not considered relevant was included in the CI.
For both scenarios, clinical insight and experience can help you with interreting CI and interpreting the results in a trial.
Next slide
52. Is this relevant?
Is this valid?
Is this reliable?
Is this important and meaningful?
Is this applicable or generalizable? Now that we�ve determined relevance, validity of the trial, and verified the trial results, the next step in critical appraisal is to evaluate whether the findings were important and meaningful.Now that we�ve determined relevance, validity of the trial, and verified the trial results, the next step in critical appraisal is to evaluate whether the findings were important and meaningful.
53. 4. Making sense of it all:Is this important and meaningful? Do the results make sense?
Do the results provide anything new?
Do the results confirm a prior conclusion?
Will this change my practice?
Do the concluding remarks match the results?
A way to assess importance or significance is to ask a few questions: do the results that were found make any clinical sense? Did the authors discover anything new? Will this change my practice? Or do the results confirm a prior finding?
Finally, it is important to check whether the authors appropriately interpreted and summarized the results in their concluding remarks. This is important to do because ften times, the conclusion section of trials tend to over state or inflate positive findings or spin negative findings making them sound positive.
Next slideA way to assess importance or significance is to ask a few questions: do the results that were found make any clinical sense? Did the authors discover anything new? Will this change my practice? Or do the results confirm a prior finding?
Finally, it is important to check whether the authors appropriately interpreted and summarized the results in their concluding remarks. This is important to do because ften times, the conclusion section of trials tend to over state or inflate positive findings or spin negative findings making them sound positive.
Next slide
54. 5. Is this applicable or generalizable? EXTERNAL validity = term phasing out
New terms: APPLICABILITY or GENERALIZABILITY
Was enough information regarding population (eligibility criteria), interventions, outcomes, study design, and setting reported such that I can apply the results to my patients or generalize the findings to a broader population?
Last step in criical appraisal is figuring out whether the results are applicable to your patiient�or generalizble to broader populations.
You may have heard of the term �external validity�---and applicability or generalizability are now the new terms for this concept.
Here were are trying to determine whether enough information regarding population, internvention, comparator, outcome, and setting was reported such that you can apply the findings appropriately.
Next slideLast step in criical appraisal is figuring out whether the results are applicable to your patiient�or generalizble to broader populations.
You may have heard of the term �external validity�---and applicability or generalizability are now the new terms for this concept.
Here were are trying to determine whether enough information regarding population, internvention, comparator, outcome, and setting was reported such that you can apply the findings appropriately.
Next slide
55. 5. Is this applicable or generalizable? Population
Recruitment methods?
Disease severity or duration of illness?
Run-in periods?
Interventions
Study medication na�ve?
Dose, duration, other allowed interventions, adherence?
Level of training for those who assessed intervention?
Outcomes
Long term health outcomes relevant to patients?
Intermediate (or surrogate) markers used?
Setting
Specialty setting or general setting (in-or outpatient)?
Country?
Here is a short list of a few characteristics that should be considered when evaliating applicability or generalizability. Some items that you may want to ask yourself when reading trials is: how were patients recruited�did they volunteer or were they referred? What was the severity of the diseases that were included? Were the patients na�ve to medications? Where was the study conducted? So, on and so forth.
Next slideHere is a short list of a few characteristics that should be considered when evaliating applicability or generalizability. Some items that you may want to ask yourself when reading trials is: how were patients recruited�did they volunteer or were they referred? What was the severity of the diseases that were included? Were the patients na�ve to medications? Where was the study conducted? So, on and so forth.
Next slide
56. Summary
Is this relevant?
Is this valid?
Is this reliable?
Is this important and significant?
Is this applicable or generalizable?
Developing critical appraisal skill set is important for providing quality care
Brings awareness of current medical practices and highlights areas where more research is needed
We�ve just reviewed 5 general steps in critical literature evaluation of randomized trials for drug therapy: is this relevant, is this valid, is this reliable, is this important, and is this applicable. Keep these concepts in mind and continue to practice your skills because cultivating critical appraisal skill set is important for providing quality care.
Awareness of the strengths and limitations of the body of evidence is needed in order to best understand how to optimize the practice of evidence-based or evidence-informed medicine.
Next slide
57. Acknowledgements Attorney General Consumer and Prescriber Education Program
Members of the technical advisory committee of this grant
Office for Oregon Health Policy and Research
The University of Texas Southwestern Medical Center
The Federation of State Medical Board�s Research and Education Foundation
I would like to acknowledge the attorney general consumer and prescriber program, the members of the technical advisory committee for review of the module, the office for Oregon health policy and research, the univ of Texas southwestern med center, and the federation of state medical board�s research and education foundation.
Next slideI would like to acknowledge the attorney general consumer and prescriber program, the members of the technical advisory committee for review of the module, the office for Oregon health policy and research, the univ of Texas southwestern med center, and the federation of state medical board�s research and education foundation.
Next slide
58. CME instructions Please complete the survey, CME questions, and program evaluation after this slide
Don�t forget to click the finish button at the end of the CME questions
You should be directly linked to a CME form which you will need to fill out and fax, email, or mail in order to receive credit hours
Please complete the survey, CME questions, and program evaluation before exiting the session. After you have completed the CME questions, don�t forget to click he finish button�this will directly link you to a CME form which you will need to fill out and fax, email, or mail in order to receive your credit hours.Please complete the survey, CME questions, and program evaluation before exiting the session. After you have completed the CME questions, don�t forget to click he finish button�this will directly link you to a CME form which you will need to fill out and fax, email, or mail in order to receive your credit hours.
59. RCT