Download
1 / 18
190 likes | 652 Views
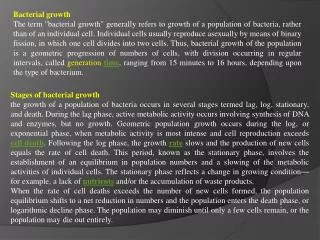
Prokaryotes and bacterial growth curve. This lab Bacteria, Archea Bacterial morphology, reproduction and growth curve How to calculate generation time How to draw a growth curve Exercise on phase contrast microscope Inoculating some plates. Domains of life. Domains of life.

E N D
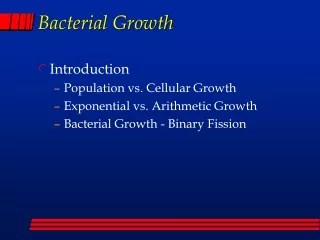
This lab • Bacteria, Archea • Bacterial morphology, reproduction and growth curve • How to calculate generation time • How to draw a growth curve • Exercise on phase contrast microscope • Inoculating some plates
Domains of life Blue green bacterium Eukarya Archaea chloroxybacteria Chlo.A schizomycetes Intracellular organelles Muramic acid Chlo. A&B Nuclear mem. DNA transcription factors DNA RNA ATP
Bacteria and Archea • Bacteria and Archea are unicellular organisms. • For long time, Archea used to be grouped with bacteria • but it was separated later on. Generally Archea can be described as bacteria able to grow and multiply in extreme environmental conditions (high temperature, high salinity,….)
Why to study Bacteria and Archea • Many of them produce diseases (HUS caused by E. coli O157). • Others are beneficial (lactobacillus species is used in yogurt, bacteria in association with plant roots supply nitrogen). • Archea is good source for restriction enzymes
Bacterial morphology • Bacteria has many shapes • B.subtilis is bacilli (rod shaped)
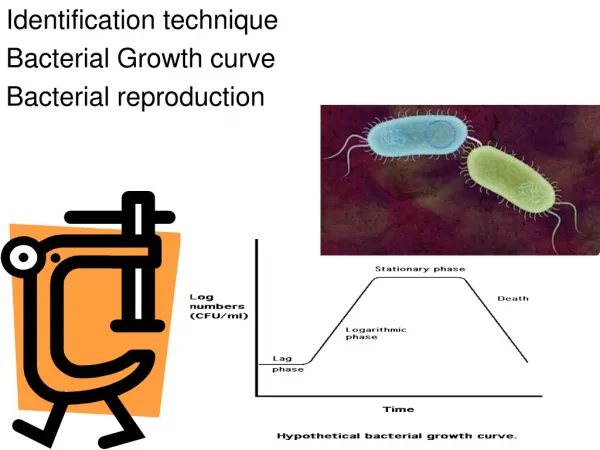
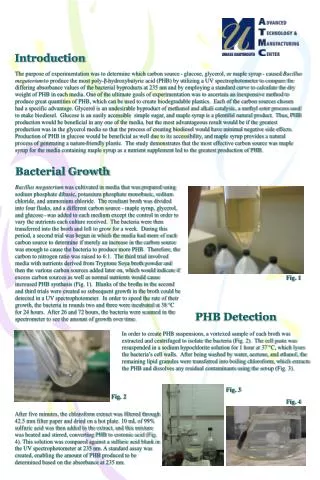
Bacterial reproduction • Simple binary fission (Asexual) • The bacterium double its content then divide into two • Bacterial motility http://www.bme.jhu.edu/~skuo/emph_ListSteps.html#Relevance
Bacterial growth curve • Bacteria grow in population called Culture • Binary fission result in “geometric progression in number” which is termed exponential growth • 1-> 2-> 4-> 8->16 -> 2n…. • Generation time (doubling time):time needed for division
How to calculate generation timefrom data set • n = 3.3 x log (P/p) • n= number of generations • P= final population number • p= original population number • Generation time = time elapsed to reach “P” • minute/generation n • *example page 38
How to calculate generation time • How to determine the population number? • By usingspectrophotometer(A600) Detector….reading light 600nm Different reading
What to do 1- mark your tubes (on the upper part) 25C and 37C 2- using the Blank tube adjust your machine to zero absorbance (on the lower scale using right knob). You do not have to do this step again 3- aseptically (using pasteure pipette) take 4 ml from each culture into each tube then take the reading. 4- return the the 4ml back to the culture and turn on the shaker 5- repeat step 3 and 4 every 30 minutes P.S make sure that you return it to the correct culture otherwise it will spoil all the work
How to draw a growth curve at the exponential phase * Plot you A600 or log A600against your time point Log A600 A600 Log A600 A600 Time in minutes
How to calculate generation timefrom a growth curve * If you have the growth curve of certain bacteria (exponential phase), you can calculate the generation time by this equation *generation time= time elapsed x log2 logA600 *example in page 38
Microscope * Staining of biological specimen enhance visibility *What you should do 1- mount the slid on the stage 2- chose the low power lens and start to focus using the coarse focusing the fine focusing. 3- chose another objective lens and repeat 4- your goal is to have clear sharp view of what you are examining
c Lab report on bacteria and bacterial growth curve • Worth 15 point .due next week in class • Topics to be covered • 1- title :chose suitable title from your creation (1) • 2-abstract: summary of the report (3) • 3-introduction:background (3) • 4-experimental procedures (1) • 5-results : include page 39&40 from the manual as attachments)(3) • also include tables (A600 readings) • 6-discussion (4) • 7-references: cite any references you used in you report • There is a handout on what is expected in lab. report. • There is a handout on group members participation. • I will post an example Lab report (on a different topic) • today.