Download
1 / 13
130 likes | 474 Views
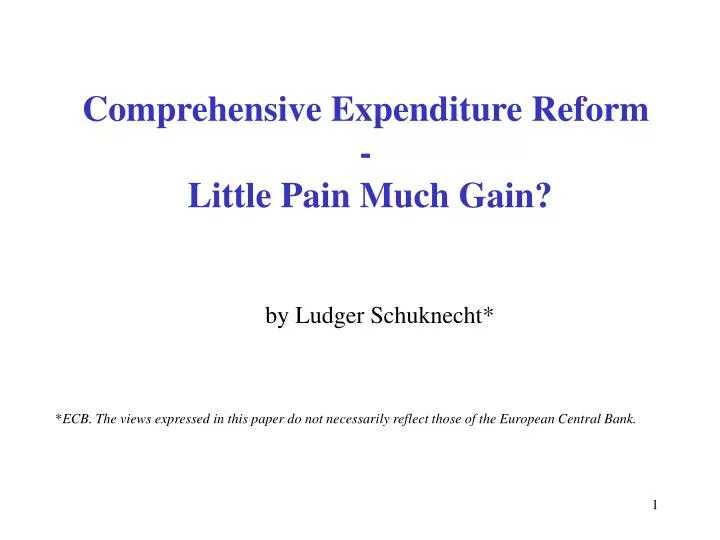
Comprehensive Expenditure Reform - Little Pain Much Gain?. by Ludger Schuknecht*. * ECB. The views expressed in this paper do not necessarily reflect those of the European Central Bank. Introduction. Alesina and Giavazzi call for reform in many sectors in Europe

E N D
Comprehensive Expenditure Reform - Little Pain Much Gain? by Ludger Schuknecht* *ECB. The views expressed in this paper do not necessarily reflect those of the European Central Bank.
Introduction • Alesina and Giavazzi call for reform in many sectors in Europe • I zoom in on public expenditure reform in potential “role models” • Confirm A&G • Much to gain, little pain!
Greece (2000) 52.0 Luxembourg (1981) 51.9 UK (1981) 50.7 Germany (1996) 50.2 Non-euro OECD 49.7 Spain (1993) 47.6 Portugal (2004) 46.5 Japan (1998) 41.0 Australia (1985) 40.2 United States (1992) 37.2 Switzerland (1998) 34.8 Maximum public spending ratio (year) Big Government Retreating? Sweden (1993) 73.0 Finland (1993) 64.8 Belgium (1983) 63.8 Recent public spending ratio, 2004 or most recent Denmark (1993) 61.3 Netherlands (1983) 58.3 Sweden 57.1 Total expenditure, general government, % of GDP Maximum versus recent data Italy (1993) 57.7 57.4 Austria (1993) Denmark 55.1 56.5 New Zealand (1985) France 54.0 Ireland (1982) 56.2 Finland 51.5 France (1996) 55.4 Austria 50.4 Euro zone 55.1 Belgium 50.2 Canada (1992) 52.6 49.9 Greece 48.6 Italy Germany 47.5 Euro zone 47.0 Netherlands 47.1 Portugal 46.5 Luxembourg 45.6 UK 44.1 Non-euro OECD 42.0 Canada 39.7 Spain 39.0 Japan/New Zealand 38.6 Australia 36.3 United States/Switzerland 34.3 Ireland 34.0 ICs (1960) 27.9, similar to today’s Asian NICs ICs (1913) 12.7 Source: ECB and Tanzi and Schuknecht, 2000.
Expenditure reduction in countries with ambitious reforms (maximum – today) Ambitious reformer = primary expenditure reduction by >5% of GDP within 7 years after maximum. Borderline: Austria, New Zealand, Luxembourg Source: Hauptmeier, Heipertz and Schuknecht (2006)
Comprehensive reform agendas in all cases… 1/ Decline in primary expenditure. Source: Hauptmeier, Heipertz and Schuknecht (2006)
4 3 Trend GDP growth (%) 2 1 T0 T1 T2 T3 T4 T5 T6 T7 Ambitious reformers Timid reformers Trend growth improving…
Ranking of per capita gross national income, PPP adjusted (2004) and its change 1980-2004
Spending must be efficient, not necessarily high… Public education spending and PISA reading scale 550 Finland Japan 540 UK 530 Netherlands 520 France Sweden 510 Ireland Belgium Mean score PISA science scale, 2003 500 Germany US Spain Austria 490 Italy 480 Greece Luxembourg Denmark 470 Portugal 460 3 3.5 4 4.5 5 5.5 6 6.5 7 y = -2.0383x + 513.13 Public spending on education in % of GDP, 2002 2 R = 0.0076 Source: OECD
6.0 Finland 5.0 Italy 4.0 UK Japan 3.0 Sweden US 2.0 Luxembourg Germany Netherlands Austria 1.0 Greece 0.0 France -1.0 Denmark -2.0 Ireland -3.0 -4.0 2 = 0.2079 y = 0.2462x + 1.6646 y = -0.0052x + 0.4129 2 R = 0.3255 R Social spending reform may hurt income distribution little… Gini coefficient and social spending 0.4 0.38 Portugal 0.36 Italy United States Greece 0.34 Spain United Kingdom 0.32 Gini coefficient, about 2000 Japan Change in the Gini coefficient, mid 1980s-2000 0.3 Ireland Germany 0.28 France Finland 0.26 Netherlands Luxembourg Austria 0.24 Sweden 0.22 Denmark 0.2 12 14 16 18 20 22 24 26 28 30 -10 -5 0 5 10 Public social spending, about 2000 Change in social spending, mid 1980s-2000 Source: OECD
Economic freedom improves… Expenditure reform and economic freedom 2.5 2.0 1.5 Change freedom indicator, post reform 1.0 0.5 0.0 -20.0 -15.0 -10.0 -5.0 0.0 -0.5 y = -0.0793x - 0.056 Change expenditure ratio, post reform R 2 = 0.3453 Economic freedom as defined by Fraser Institute excluding public finance elements
Conclusion • Reform experiences confirm messages in Alesina & Giavazzi (and their earlier work) • Ambitious expenditure reform as part of comprehensive packages coincide with experiences of: • an improved fiscal, institutional and growth outlook • at little cost (if any) to social indicators • Reforms strengthen incentives/opportunities!
Bibliography • Expenditure Reform in Industrialised Countries: A Case Study Approach (with S. Hauptmeier and M. Heipertz), ECB Working Paper No 634, May 2006. • Reforming Public Expenditure in Industrialised Countries: Are There Trade-Offs (with V. Tanzi), ECB Working Paper 435, published in Politeia (London) and in P. Wierts, S. Deroose, E. Flores and A. Turrini (eds.) Fiscal Policy Surveillance in Europe, Palgrave, (April 2006). • Public Spending in the 20th Century: A Global Perspective(with Vito Tanzi), Cambridge University Press, 2000.